Example 1: Logic bound
If you see something like this, it’s not necessarily bad.
You’ll notice that the duration is 20m, but the database time is 8.8 seconds. This is NOT causing the database grief, and it probably only in a loop in the UBE.
This means that the UBE is in the main loop and might be crunching some logic or perhaps some smaller sub queries based upon the main query.
Example 2: Database busy
But, if we look at another statement, we can see that the database time and the execution time are about the same. So this one is hurting the DB, and I bet that the UBE is doing nothing but waiting. We can also see that the blue is IO and the green is CPU, so this is doing a lot of disk I/O.
We can see that this is a runbatch process on bear, and we need to drill down to get the PID
Drilling down on the user session give us:
Great, so now I know the OS process id, and will look into this on bear – but it’s not at the top of top. remember our theory that it’ll be waiting.
ps –ef |grep 15928
When we find it, we can see that it’d hiding…
jde900 15928 9313 0 16:05 pts/1 00:00:00 runbatch JDE pgAAAAQDAgEBAAAAvAIAAAAAAAAsAAAABABTaGRyAk4Acwg4AC4AMQAwABSBWpC+uTe3+KbaUoYl6eW/UPqPT2YAAAAFAFNkYXRhWnicHYpBDkAwFEQfGqew6AVIFWFLiESErV0P4XoOZ9qfzJuXzH8BU+RZpv5y0pUHKxvGYqkCOyc3C7P6ksUtKA+9x9EyUqsH0dMn72jkQ6IT4xo/J+38q3ML4A== PY900 *ALL 12481590 /u01/jdedwards/e900/PrintQueue/R56120_F5004_12481590_PDF
Interestingly this process is doing nothing, so it is waiting on the SQL
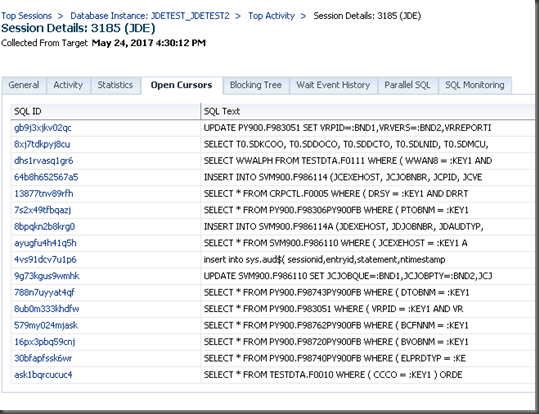
Some really cool information you can see when drilling down into the session is:
That’s all the SQL that it’s run from inception, as a batch process is a new process. Note that this does not have any of the system or security statments, as they go to a different instance.
This is a really nice way of being able to track back what the UBE / SQL is doing and who is waiting on what.
Example 3: Logic bound
once again, this is a job that has a long duration, but only 21 seconds of database time… So really, I’m not worried about it. It does give me a good chance to explain a number of aspects about it.
As I suspected, this is doing a lot of work at the UBE server end.
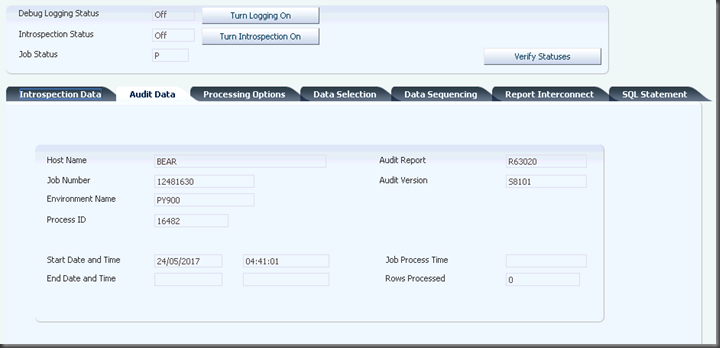
We can use the process ID field in WSJ to find the batch job we are dealing with… easy…
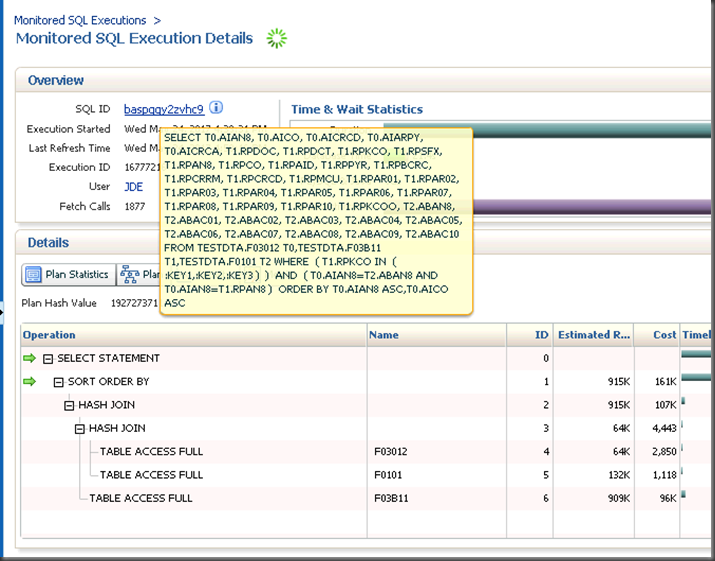
Now we can look at execution detail to see the main select loop.
We see that this has not executed a single loop (not too sure about that)
Wow, Enterprise Manager tells us the same SQL is running, that is handy.
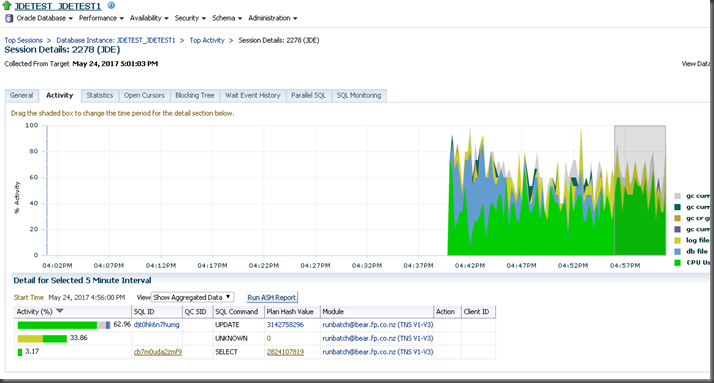
We can also see when we look at the detail of the session, that it’s also running some updates and selects on other tables within the main loop. This is what we do not see in JDE execution detail. We can also see that this is the update that seems to be taking the time.
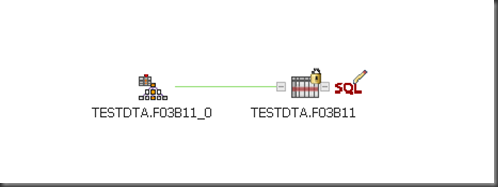
We can see that this is probably a loop over the F0150 and then processing updates to the F03B11.
You can find this under session details –> activity tab
Despite that this is taking the main lions share of the inner activity, it’s not doing that much in the scheme of things:
So I do not mind about this either.






2 comments:
Awesome post Shannon! Thanks.
I have followed this logic to trace PIDs and get to the UBE or even user action.
Have you seen cases in which the PID shows as "1234" and it doesn't exist as such in the OS?
Hi Andres,
This could occur if the "client" side process has crashed or finished or "given up". This can happen often from JDBC, as there is a client side timeout that often not cancel the statement as such - but just give up on it.
Shannon
Post a Comment