You've got some big JDE changes planned and you want to make sure that you have a baseline of activity and performance (and logs), so that you can compare against this after the change. What you are really doing is making sure that the feedback loop for change is working, so you can evaluate the change and therefore improve how quickly and accurately you can implement change.
My recommendations are to get prepared at least 1 week before the change and start to gather the information. What sort of information is important?
App Servers
- CPU
- Disk
- Memory
- Logs
- UBE performance
- UBE wait time
Web Servers
- CPU
- Disk
- Memory
- Logs
- Website performance
Database Servers
- connections
- high I/O statements
- high CPU statements
- temp usage
- CPU
- Memory
- Disk
In reality if you are using too much CPU, then you probably have something setup wrong in JDE, as I never see JDE using that much CPU - or you really have your hardware maximised (or you are running things on your phone).
Remember that you need a baseline of everything - and this can be done at any time of the day, any day of the week. If you understand exactly what a "week in the life of" means.
App Servers
These are easy. Generally punchy CPU. Kernels can use a lot of memory. Some batch jobs are pretty intensive, but you must be running them highly parallel to affect the performance of the machine. The metrics from the machine are going to be helpful, but I must admit - what you really need to worry about on these machines is the performance of the batch jobs.
Batch jobs are running functions and if you want a generic health measure, I recommend dividing your batch jobs into 3 categories.
- Punchy
- IO intensive
- CPU intensive
If you can get sample average runtime, rows processed and wait time for the above - you'll be able to determine if the "change" that has been done has had any affect on your environment.


You can then take this a step further and understand the runtimes on a daily or hourly basis to ensure that there are not any dangerous trends that you are dealing with.
UBE wait time is an important measure too, as this will show you if your nightly scheduled jobs have moved significantly.
Web Servers
Web servers use a lot of memory. Watch lists and other AIS based options are starting to take their toll on performance. I certainly recommend separating these out. There are some good articles on this process. AIS and Orch can be load balanced from the web server, this is also a good idea IMHO. Don't just run watchlists locally and expect everything to be peachy.
There have been many improvements in threading in orchestration (read AIS) in the latest tools releases 9.2.4.4, if you are running large and complex orchestrations, get on the latest release.
Web servers can get caught up in garbage collection. You do need to look out for this and make sure that the cycling is not too much. The JVM can lock up for the time it takes to run the collection - so make sure that your sizing and startup parameters are correct.

I use a graphic like the above to work out the sweet spot for users on a JVM. There are a lot of dependencies here, but you can be fast with 80 users on a 4GB JVM. I mean 80 active users. The graph above shows average daily response times (which I could make hourly) and also how many users logged in for that day. This is really cool for JDE. I'm actually representing Avg page load time, (Avg Page Load Time : The average amount of time (in seconds) it takes that page to load, from initiation of the pageview (e.g., click on a page link) to load completion in the browser. Avg. Page Load Time consists of two components: 1) network and server time, and 2) browser time.)
Like my impressive bands? The two red lines indicate an upper and lower performance thresh-holds. I'd consider things slow or (too fast, can you be too fast?) if they were outside of those bands.
The graphic above is a summary of > 2 million JDE page loads. This tells me two things, firstly that on this site, 450 users can perform as well as 40 users - so scalability is not an issue for them. JDE always performs better on the web under some type of load.

The above shows us a pretty cool indication that you get good performance in general every minute of the day for up to 20 users in a single minute (this is interesting in itself - as we only are recording up to 30 people in a single minute asking for new pages).
Database Server
Once again the database server is the most critical item in all of the above, as it underpins every single thing you ask JDE for... But, the database statistics alone really tell you nothing without a baseline and all of the "actual" user data that you see above. When you can equate adequate performance (which I class as < 2 user complaints a day - haha), with a pattern of CPU / Memory / poor performing statements - then you know your database is performing well.
Another critical item for all you people considering cloud, is that you need to get your IOPs right. IOPs cost money in the cloud, so you REALLY need to understand this before committing to an architecture that just won't support what you need.
Log file analysis
I'm lucky enough to have a blackbelt in AWK and GREP and also a purple belt in regular expressions. This allows me to use a linux VM (which mounts local dirs off my machine) to rip through log files and create a baseline.
Some favs like:
grep -i -r COSE#1000 |grep BSFN | awk -F: '{print $10}' | awk '{print
$1}' |sort |uniq -c
|
21 |
ApproveLoad |
|
4 |
BatchReviseOnExit |
|
6 |
BuildTransToBatchHeadersWrapper |
|
2 |
BuildTransWOAcctMasterWorkTable |
|
1 |
CheckItemBranch |
|
1 |
CreateLoadBegDoc |
|
3 |
DeleteOrderAddress |
|
18 |
DeletePrinterFile |
Which will give you a nice list of functions that have timed out and how many times they have timed out in the logs that have been given to you.
What I then generally do is place these on a timeline too, because they all could have been done as a single error (bad start / network problem), you need to get a frequency pattern.

But, if you are an uber nerd - then you get something like this:
You install cloudwatch agents (for example) on prem or not. And you configure them to "watch" all of the JDE log files [with some smarts] and then you can report over the top of ALL your logs. (which I touch on here: https://shannonscncjdeblog.blogspot.com/2019/08/tip-9-monitor-relentlessly.html)
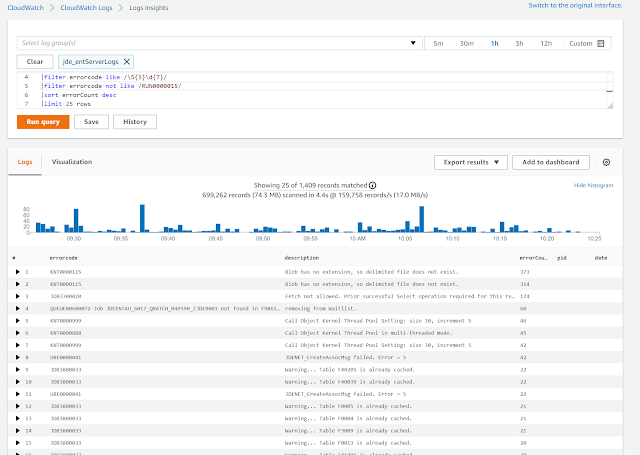
So what I can do (and you can see from the above). I can look at the last year of JDE log files and I can ask the cloud console to summarise the logs using the regex that I have provided, so I can see if the incidents of errors have increased or decreased over time (especially important when introducing new technology).
fields @message,@errorcode, @pid, @date, @time
|stats count(*) as errorCount by errorcode, description
|parse @message /(?<pid>\d{3,})\s(?<date>\S{3}\s\S{3}\s\d{1,})\s(?<time>\d{2}:\d{2}:\d{2}.\d{6})(?<module>.*)\.c\d{3,}\s(?<errorcode>.*)\s-\s(?<description>.*)/
|filter errorcode like /\S{3}\d{7}/
|filter errorcode not like /RUN0000015/
|sort errorCount desc
|limit 25 rows
What I do in the above is carve out the JDE log file lines that I want and create my own custom fields with the results. I then ask the console to display those results.
Of course this can be done for ORA- errors or anything.
It gets better, then I just need to create some metrics and then some alarms based upon queries like this.
I then get messages when my alerts see too many incidents of particular issues.
So this is a complete automated logging solution for JD Edwards - whether you are on premise or any cloud - this can work for you.
In conclusion
- Change is inevitable.
- Create a baseline of performance
- Create a baseline of logs
- Get good at automated instrumentation and Alert->Analyse->Act for your system usage and logs
- Be generic and automate your monitoring
- Get the monitoring to do all the hard work

Remember, this is the CORE of the feedback loop in your CI/CD pipeline adoption in JDE. You cannot continuously improve without the instrumentation.


