One of my clients was complaining that then they used orchestration client (to call an orchestration) - it always picked up the new changes, but when they used postman (to call the same orchestration) - the changes were never in the resulting payload. I (of course) stated that this was impossible and that the calls from postman do exactly the same thing as orchestration client and my customer must have been wrong...
But, it seems that there might be a large amount of egg on my face, for two reasons.
- Architecture
- cache clearing
Architecture
When we set up orchestration studio and AIS, Fusion5 generally create a couple of instances of each. The reasons for this are that we have a bunch of mobile applications using AIS, so we want them to come into their own AIS instance, then then points to it's own dedicated HTML server. Makes sense? Yeah! This is also complicated by the fact that we have a custom domain which points to an AWS ELB which points to a nginX server, which proxies the actual traffic! YAY. IT is actually a really nice setup.
We do the above so that we don't have funny ports in our URLs and we can do HTTPS offload. Some simple nginx commands can serve up all of the environments from a single server on 443 or 80 - this is really nice and neat. If you have crazy ports in your environments - you need to stop - browsers are shutting this down pretty quick.
Oh, the OTHER AIS instance pair is the HTML server that all normal users log into, and of course this needs an AIS server now for all of the watch lists and other items. So we create these separately. This IS the instance pair that we hook up to orchestration too. See my confusing diagram below.
So orch needs an AIS server, which points to an HTML server which points to an AIS server (I personally think that this is stoopid). You get double connections on all of your HTML servers now because of AIS connections. So you need to double your "maximum users" setting in JAS.INI because of all the extra sessions...
Anyway, I'll stop complaining and get back to the issue...
I think you can tell from my explanation above, that the external postman link was pointing to 1 AIS server (9062) and orchestration studio was pointing to another (9052). This was a fundamental architectural reason for the cache not being cleared on the AIS server, but this was not the only reason.
I think you can tell from my explanation above, that the external postman link was pointing to 1 AIS server (9062) and orchestration studio was pointing to another (9052). This was a fundamental architectural reason for the cache not being cleared on the AIS server, but this was not the only reason.
| Diagram showing multiple servers and their purpose and relationship |
cache clearing
The second reason was that when you log into the orchestration client, it clears the cache for the AIS server that it is part of - magically. So, when you run any orchestration from the client - it picks up the latest version of the orchestration - nice. But, if you are not logging into the AIS server client component - then the cache is NOT being cleared. Therefore postman is picking up some old crap and displaying it.
All that needs to be done is that someone needs to login to the client component of the AIS server behind the proper domain name (9062), and BOOM the cache is cleared.
We could also give our client a cURL command or something that would force the cache clear too - essentially pressing the clear cache button from the client.
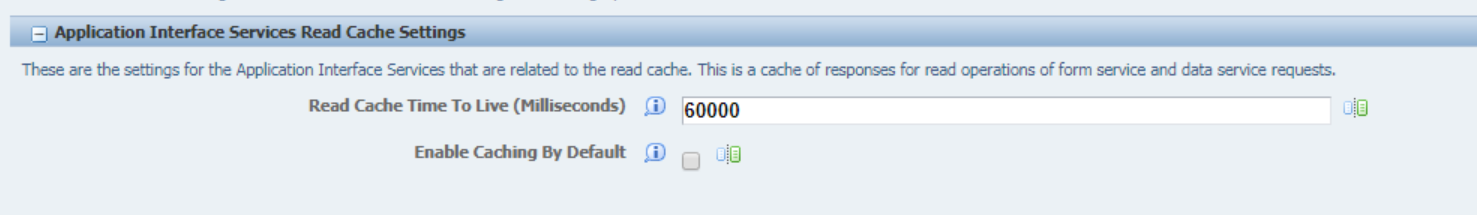 |
| These are my cache settings, cache is not enabled - but it's certainly on! |
So, case closed. We provide linked to the AIS client that is being exposed externally, client logs into said orch client (9062) and the cache is cleared and postman shows the correct data.

