Monitoring anything is EM12C is very good, although sometimes it’s a little bit chatty. I’ve got the JD Edwards plugin connected at a couple of sites, and this is great to monitor a myriad of different metrics, but out of the box there is “status” of the individual end point. What I find at a number of clients is that eventually something gets knocked out of sync, and EM12C reports the enterprise server instance down when it is NOT. SM reports it up, it’s quite frustrating.
A Bounce of the JD Edwards SM agent fixes the EM12C status, which is also weird. I will do some root cause analysis at some stage, but I need to stop these emails!
So, I’m ging to employ the concept of corrective actions. Note that it seems at this stage you cannot call a standard job as a corrective action (which seems stupid), you can only call a specific job which is of type “corrective action”.
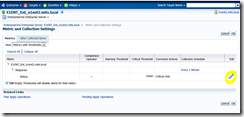
I created the above thinking that I could attach it to the incident rules, but this is not how corrective actions work. You need to go to the metric collections area for the metric that you want to associate a corrective action too:
Goto metric and collection settings
I get the following everytime, just try again!
Add
OS
Find in putty where “restartAgent” lives on the enterprise server you are having issues with
Enter the creds for the user that runs SM, in my case jde91
Job done, so now when I get an alert (incident raised that the JD Edwards enterprise server services are down, I’m going to restart the SM Agent), then I’ll monitor for another message in another minute – if I get that, then I’ve got a problem!
That is a nice neat way of attaching a script or corrective action to a monitoring alert with JDE.
What can be monitored with EM12C and an enterprise server (using the licensed JD Edwards management pack).
Look at what you can monitor if you care


No comments:
Post a Comment