I should make some observations about performance analysis and try to group them into some logical areas.
Firstly you need to quantify performance against a known benchmark or your own benchmark. In general, everyone’s ERP is different so the most beneficial comparisons will come from your own benchmarks. Performance can generally ALWAYS be improved. It can be improved with hardware, software, code, data or process changes or a combination of the 5.
Where do performance problems commonly start from:
This is a difficult question to answer – but, I’ll provide a list and some examples
- database – this is generally the cause of many performance issues, especially for an ERP like JD Edwards. JD Edwards is database agnostic, which means that it’s queries and interface to the database are written generically. This is fantastic if you ever want to change database platform, but it comes at a price. The price is specific ability to implement database tuning on a platform by platform basis. Don’t stop reading now, there is more.
- Each database that is supported on JD Edwards gives you the ability to tune queries outside of the ERP, so this is not a limitation of the ERP – it’s how you manage it. For example on an oracle database you cannot implement hints via the oci based API’s that JD Edwards provide you with. But, you can implement a database profile to effect the same changes.
- All databases allow you to look at poor performing statements and address them with various panacea’s. Indexes, etc.
- Size of data. This is critical, I always recommend to maintain the database size and then you’ll not be continuing to tune – as everything will be in a nice performance equilibrium. Statistics won’t need to change – everything will be running sweetly.
- Indexing in general. Look at your read to write ratio’s, generally a new index is not going to hurt you. If you are worried about updating indexes and the time it takes (you should), then look at what indexes have not been used over the last 6 months and drop them (yes – you heard me).
- Hardware allocations. this is the most basic problem with the most basic fix (unless you have all 128 cores allocated and you still need more power). This is simple to diagnose and simple to fix in their virtual world – look at the stats and allocate more where needed. More memory on the DB server, bring the data closer to the CPU!
- Software tuning. Generally, this is where all of the action is going to occur and where you are going to get a lot of gains. This can be changes to code, changes to process or changes to configuration. Look at the classic bug with urnandom that I posted about earlier. This will bring a site to it’s knees, and you’ll spend weeks trying to find it. I’ve seen some of the biggest improvements come from process change, where the change of a PO (for example) get’s the software to skip a certain unrequired step and turn it all around.
- network, this is becoming less critical given the 1GB and 10GB networks that are being seen at the moment. WANs are getting better and network prioritisation is getting better, so I see less and less of this being problematic.
What tools are available to you to fix performance issues in JD Edwards?
Native:
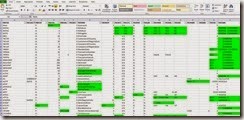
Careful analysis of batch performance (using queries like have been identified in the link.
Careful analysis of BSFN timings that you can extract from Server Manager are great for working out if there are particular BSFNs that are slow.
Performance Workbench:
download the Myriad tool that gives sub second time stamps on JD Edwards database and web functions. This benchmarks performance and allows comparison graphing with old results. Myriad will even send you information on how you stack up with industry standards – how your site compares! Myriad can tell you were you rank in terms of the many clients that have ran the software.
ERP Analytics:
Gives you unparalleled insight into performance and end user activity in your ERP. Who is doing what and when. Ever wanted to see average performance with a geo overlay – easy.
Average page load time: The average amount of time (in seconds) it takes that page to load, from initiation of the pageview (e.g., click on a page link) to load completion in the browser.
Average server response time: The time for your server to respond to a user request, including the network time from the user’s location to your server
We track all these metrics and more and allow you to view them by application, user, region (pending network geography and more).
Remember to see here for more information.
Load Testing as a Service:
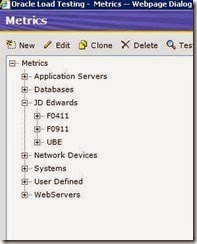
Actually load test JD Edwards with specific oracle tools and specific JD Edwards load testing knowledge. Get Myriad to load test your ERP with JD Edwards technical experts, people who know how fast JD Edwards can go and how to make improvements that make the ERP faster.


![clip_image002[6] clip_image002[6]](https://blogger.googleusercontent.com/img/b/R29vZ2xl/AVvXsEjMBtx7oAtQWxVOmvoRaHg6f_oUuwkqNj_iuP4kqDGPxD1iwQHj2MV0wpR1KmDsJxRu0RlUtU-QUeIldT07UkQWmr6iZb2N0dU6cKfmMgGVp3cr7na4ZMhcBT3MJGRMrfx6IkgKPc0IHRfa/?imgmax=800)
![clip_image002[4] clip_image002[4]](https://blogger.googleusercontent.com/img/b/R29vZ2xl/AVvXsEjO5N02HjJBu93CzmVoC-XQvcDelHEb-wmFM3HOZrpoAsTFCtSUVAWIoYMIhM09Hw4lwLu_hvIh6bglNlmbDp2VBXaLEE5fBqGfymXsS4a1ZhgWLUKo1FA4vrSVnj1G-5IAyo6OeCnA_5gR/?imgmax=800)


![clip_image002[4] clip_image002[4]](https://blogger.googleusercontent.com/img/b/R29vZ2xl/AVvXsEjVxBt4ymuVNtApd_1oRm513tS-rZagony3T3JbAvuNoXdit4IAanFW2ijS5UIQy5-IvtmQDlpm8WZYT0ASLtyzVwdoFKuLnUuHVngr4OpCOVXV4RHeaIrRL7Q6Mr8W-daFphN7xeI7z9aI/?imgmax=800)
![clip_image002[6] clip_image002[6]](https://blogger.googleusercontent.com/img/b/R29vZ2xl/AVvXsEgQ6MqyhsLmaWwJd9xS20fhF5jd2X2rU4JAxes3ywg7I2sV9Om7UEcyJqALeb9Jhbm7CcMrKWqgqk-DvASjvfFom3KFL6nUUPK9-3VdAZcWm96X9NulKxqwCUWzXuzMGfYAK8GRZV_1U1m8/?imgmax=800)


![clip_image002[4] clip_image002[4]](https://blogger.googleusercontent.com/img/b/R29vZ2xl/AVvXsEgD39YE8MyXLqY6U7cM1bTPjy3pKy06R9NWQOg5Zm9DS94CiwE77tRUQnKAIbJE1NLn6_YMLTVwNcaZEwoNAwmmSi1vsXv9gCI2a0fKCiA7LKs-gEHs2l0zyD5tjz6G69gCLl8l0w8b3Xq4/?imgmax=800)
