I have a client that wants to do some more pro-active monitoring of their AS/400. They want to know if something has failed before their users tell them – innovative! Different! Forward thinking! Let’s be honest, if you read the doco, there are never any problems on an AS400 and this is a waste of time – but maybe not!
I did a little bit a research and I’m amazed what is available “out of the box”. With some smarts about what to do and how JDE works on the AS/400 – monitoring is fairly easy.
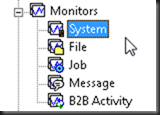
There are 5 main categories of monitoring:
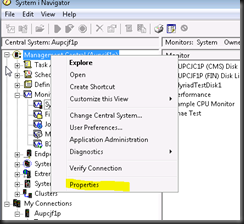
These are available from your “Management Central” location within the system I navigator.
What are you going to monitor, here is a start:
- Disk usage
- CPU usage
- Errors in certain job logs (wow, this is GREAT) [tell me if I get
- Errors in QHST log file, errors in any log file
- Message in queues
All very possible given the above frame work. You can just right click and start adding them. We have our AS400 sending emails when certain disk, CPU thresholds are met. We have it sending emails when backups are complete and also if there are certain messages in QHST (
SYSTEM
Note that I look at what is available (with Graph history), and then add monitors for things that I want to monitor
FILE
You can use a file monitor to notify you whenever a selected file has changed,reached a specified size, or for specified text strings.
QHST for any system problems (CPF1124 – Job start)
JDE log files for specific messages / text strings
JOB
Check jobs for certain messages in job logs
Check existence of jobs, CPU usage of job, count of jobs, thread count etc.
If a UBE is killing the system, you could actually give it lower priority – this is POWERFUL!
You could move a job out of a queue if it was taking too long, this is VERY powerful (with the use of replacement variables)
Message
Monitor for messages in a single message queue.
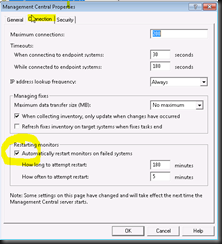
If your monitors are not auto starting
Restarting failed monitoring on the 400
you can manually select the option for “Restart on failed systems” – but this is a pain. Fix the problem permanently!
Then choose “Connection”
In my research found the following helpful:
http://publib.boulder.ibm.com/infocenter/iseries/v5r4/index.jsp?topic=%2Frzahx%2Frzahxmonparent.htm
System iSystems Management Working with Management Central monitors Version 5 Release 4
This was also a VERY good presentation http://www.lisug.org/presentations/Monitoring%20System%20Performance%20Sept2012.pdf


6 comments:
Thanks for helpful tips..
Take a look at Aellius LynX Monitor: https://www.youtube.com/watch?v=sd0USrV-Uu0. It monitors your entire E1 ecosystem (jobs, queues, scheduler, jde logs, etc.)
Regarding file monitoring, have you find out if it is possible to use replacement variables when using a command. I have found documentation for replacement variables for all the others type of monitoring but not for file monitoring.
Very nice blog post!! Thanks for the posting that is a really neat written blog.....................For more details about Tableau Training in Dallas
Nice blog post! Thank you!
Digital Marketing Service in Hyderabad
Nice Blog Data Analytics Course in Hyderabad
Post a Comment