I’ve blogged about ERP analytics a lot, I know – it gets a bit boring. But I’m trying to change that.
Fusion5 have been working on the next level of insights using Google data studio – which is NEXT level in terms of reporting!
Take a look at this:
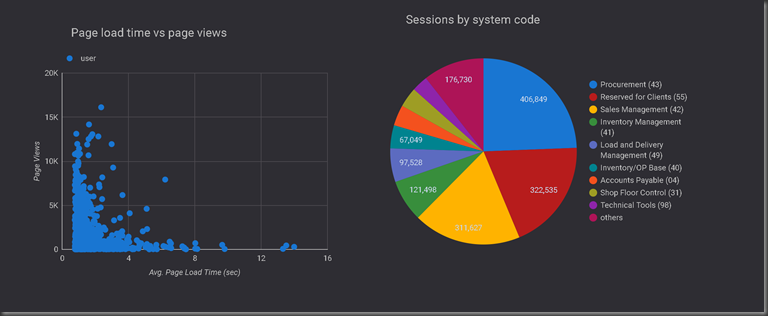
We are able to sort access by system code and tell clients what modules they are using the mod, and also look at individual scatter diagrams of page load times vs. page views – always looking for the outlying dots – what is going wrong?
The above show number of sessions mapped against page views for a period of time. We look out for user ID sharing for those users that are logging in 100’s of times for a 24 day period!
We can finally sort out the debate about the best browser, seems that chome is the fastest one at this site, well – looking at the last 1.3 million page loads!
Although this is only the beginning.
We’ve written a custom connector that allows us to connect to the data from within JD Edwards – from data studio. We are using AIS server data requests for this.
How? This is how
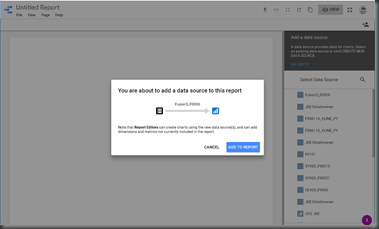
1. connect to JD Edwards using the custom JDE connector:
Then complete the details in the helper
And now you can see all of the fields for the table you chose:
You can choose the fields that you want on the report.
Great, now we start reporting
We can drag and drop data to get a dashboard view of the data in JDE – Awesome.
Here is some hard work that I did on the W@SJ tables:
So we can see what jobs are being run, what queues they are running in and also a scatter chart of rows processed vs average runtime, this is very helpful when determining performance. You can choose to view this data by queue, user or job if you need to.
If you want a beta copy of our connector – get in contact!


No comments:
Post a Comment