Wednesday, 28 November 2018

JDE licence audit (License audit)–where to begin?

I did steal this from a post I did on linked in, but I can paste better images here!

Even the grammatical rules are difficult with with word (licence), in Australia for example - when using the term licence as a noun (software licence), we spell with a couple of C's. In the US of A, things are considerably easier - only spelt with one C, license.

Are you worried about JD Edwards licence audits? Worry no more. We give you peace of mind, and allow you to easily understand what programs, modules and user activity in JD Edwards is active - and therefore allow you to understand how you sit from a licence and compliance point of view.

When is a seat not a seat? When you are talking about a JD Edwards licence! Do you know whether you need a licence is someone is just browsing the information in another system code? For example, if a user is licenced for the JD Edwards Sales Order Management (system code 42), and they look at item availability (system code 41) - do you need an inventory management licence for this? The price list certainly contains details of the separate price codes (price list). What have I been told? It's complicated. Various people have told me that you do not need a licence, and others the opposite - all these people were from oracle.

If you accept transaction licensing: (you make updates in the module).

You need to determine your counts by looking for all of the tables that are within that module (say for sales [42], find all of the tables that are system code 42 -and get a distinbct count of users that have updated records in any of these tables. You can generally do this by looking for user fields and also looking at the last transaction date. This would allow you to group by month and determine a unique list of users that have updated records in the system code.

If you do not want to do this yourself (it's trivial SQL - but will take time due to lack of indexes), there are products out there that can assist. qsoftware for example have done the heavy lifting to map tables to licenced modules and can give you some nifty reports.

Though I do caution you to be aware of multiplexing. If you are simply using 3rd party software to do the work of a JDE user, you might get caught. Read this carefully

Named User Plus: is defined as an individual authorized by you to use the programs which are installed on a single server or multiple servers, regardless of whether the individual is actively using the programs at any given time. A non human operated device will be counted as a named user plus in addition to all individuals authorized to use the programs, if such devices can access the programs. If multiplexing hardware or software (e.g., a TP monitor or a web server product) is used, this number must be measured at the multiplexing front end. Automated batching of data from computer to computer is permitted. You are responsible for ensuring that the named user plus per processor minimums are maintained for the programs contained in the user minimum table in the licensing rules section; the minimums table provides for the minimum number of named users plus required and all actual users must be licensed.

If you use the access based licensing (you use it, you pay)

That is to say, if a program is used by a user - you need a licence for said use.

You have two options here, you can use object usage tracking functionality (if enabled), which you can extract this information with SQL and perhaps some standard reports.

Or, you can use some intuitive reporting out of our ERP analytics package, showing your exactly how many users are logging in and exactly what they are doing. See more details here. These intuitive reports can show you things like:

  • Active users per module (per day / week or month)
  • image

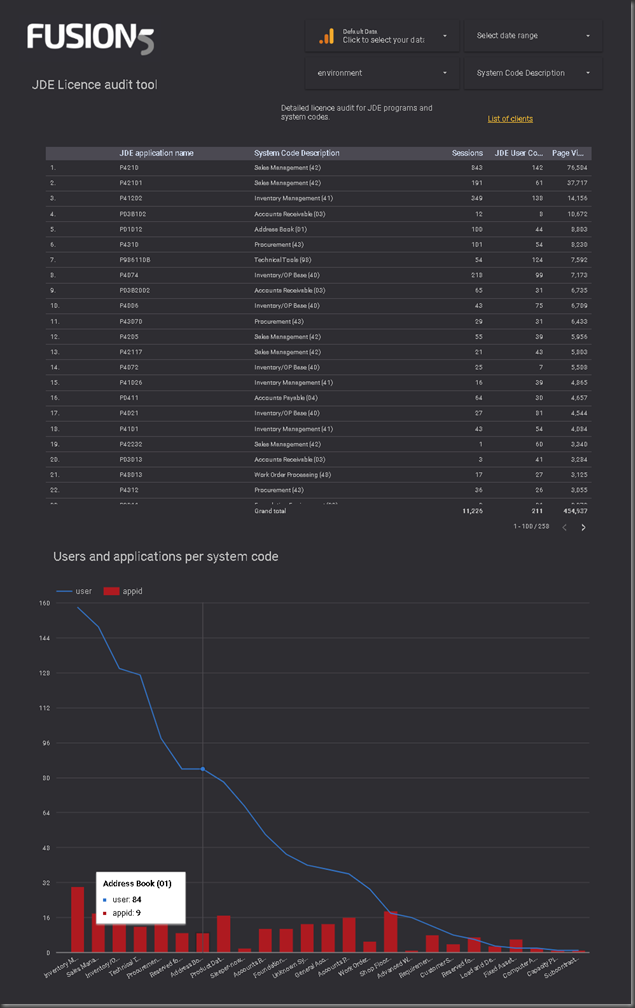
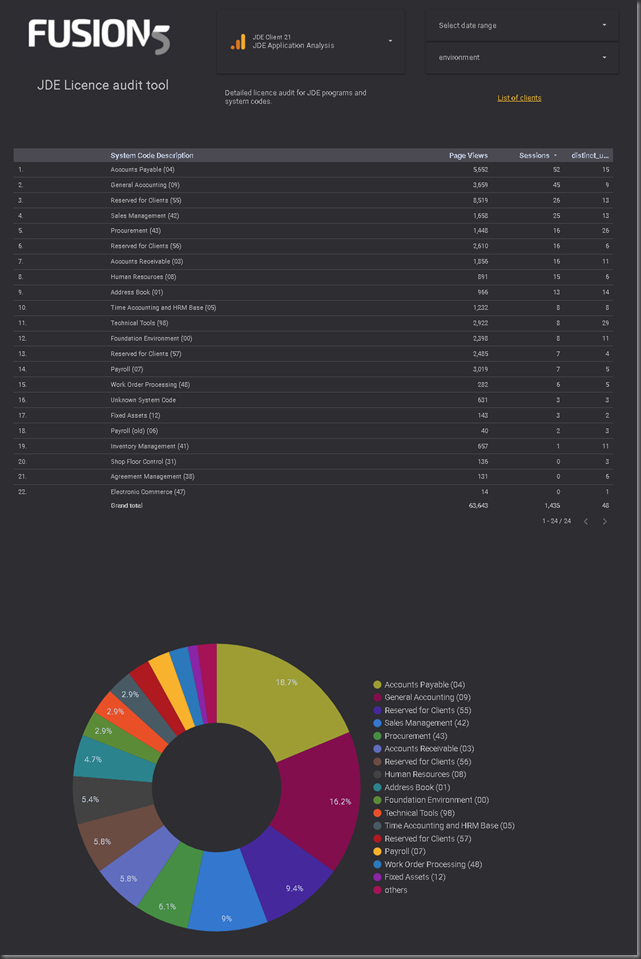
The report above shows a high level of application usage per system code.  This allows you to track back to your licence agreements and work out what systems codes you are licenced for.  Note that it can sell you how many unique applications are being used, how many distinct users are using it and how many sessions have been recorded.  This is awesome for working out what your ERP is actually doing.

  • Active programs per module - how deep is your footprint
  • image

The above report is a different take on the data, but starts to include application name.  This is good to know all of the apps that you are using wihtin system codes.  Every report can be exported to excel –simple (see below).  You can also see by system code how many users and how many distinct programs in the graph.

image


  • Active modules per user - knowing what your users need when you get new ones.

image

This report shows you how many modules and how many applications each of your users are using.  This is good for knowing the complexity of each user and comparing them.  Also handy if you need more users, you’ll know what the licence impacts are.

image

The above report is basically for export .  You can see users and applications.  For the date range and environment you supply, you can see what users have done in that period of time.  This includes now many times they have logged in (sessions) and active days of use of that program as well as how many times the program has been used.  This is really good to know what you might be able to take away.


  • historical user access, month on month and year on year (when ERP analytics subscription is active)
In summary

Talk to your partner (Fusion5 perhaps) to understand how you are going to ensure that you are not currently breaching your ERP licence requirements. We have a multitude of interactive reporting options so that you can understand exactly what you need and exactly what you are currently using.

Contact me directly if you want a demo or want to plug this into your ERP. 
ERP analytics–what is the performance impact?


I have a number of clients asking about the performance impact of ERP analytics.  What is ERP analytics a comprehensive suite of reports over the top of JD Edwards usage information.  Giving system administrators instant feedback to what is being used, how often and how fast.  You know this is you read my blog.

People get a little nervous about the effects that this might have on interactive performance, so I thought that I might allay those fears, with some data.

This is an example of me logging into JD Edwards and pulling up 5 applications and then closing them again, this is good for ERP analytics, some of them have auto-find and therefore you get an idea of the database performance and sometimes the application server performance.

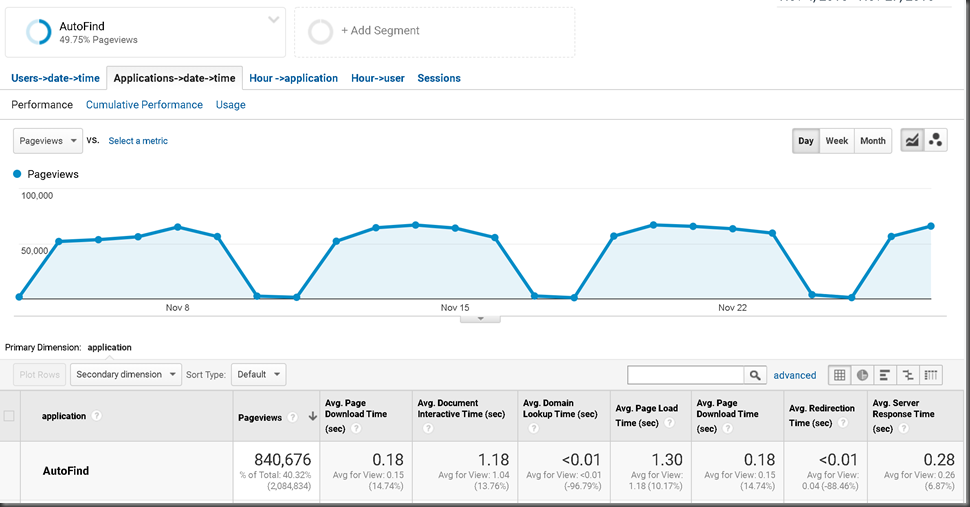
This is easy too, we can give a list of applications that have auto find and compare these with applications that do not, therefore when the database is slow – these are all affected more!  cool hey?  This can all be done with a custom segment too, for example:

So based upon my basic segment definition to have a list of forms and apps that have autofind enabled (actually best to use FORM, it’s more accurate)

image

I can see the relative performance of the “autofind” screens vs. standard screen, which allows to be narrow down those that are affected more by database slow downs. 

Back to my post…

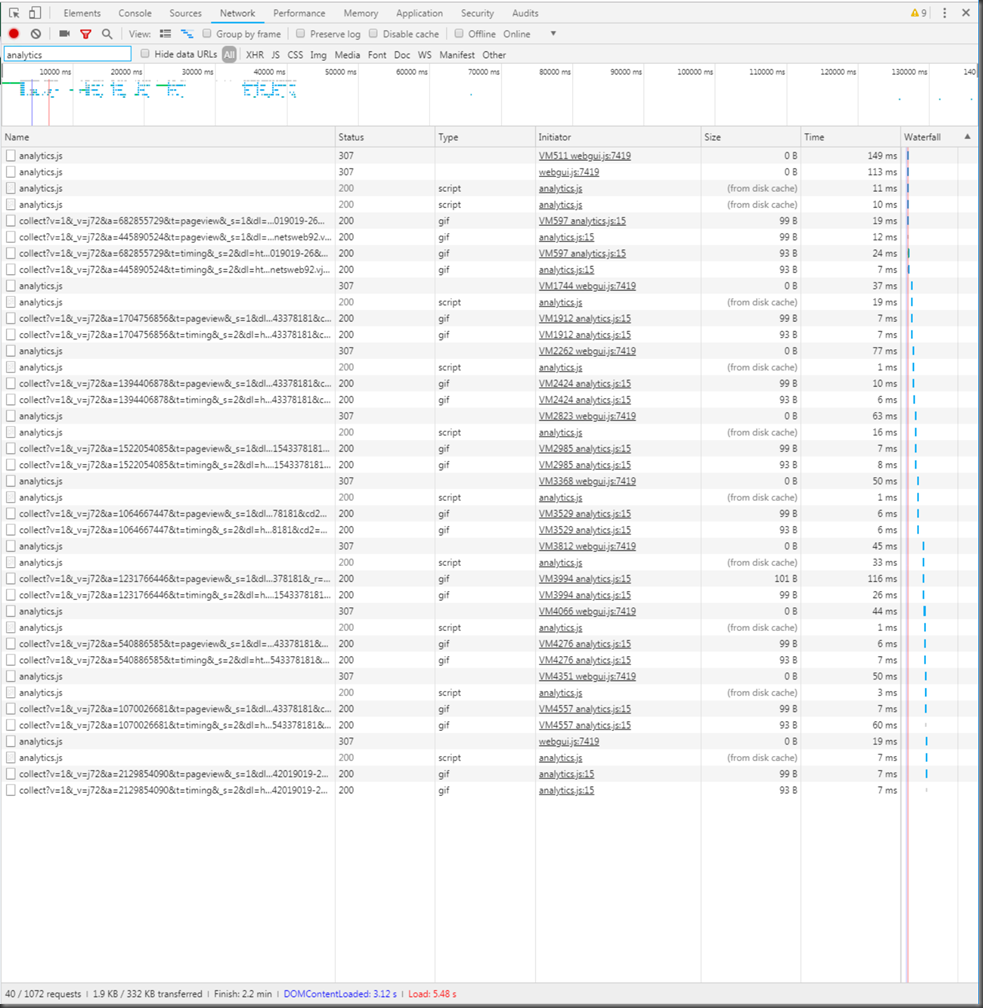
So I want to know the impact of google analytics on my ERP, I’ve got it plugged in and enabled and now I can enable developer view in chrome, this gives me some really cool stats on what is going on under the covers.

I can see that on a session that went for 2.2 minutes or approximately 132 seconds, we are sending 1.9KB (of 332KB), we waited in TOTAL for google analytics 955ms – under a second.  This has loaded and closed 5 applications and logged in and out.  So there is a lot of activity for  less than 1 second (less than 1%) delay.  Great news.


image

Remember the insights that you can gather out of this data, which actually get more valuable the longer that you have it enabled.

Monday, 19 November 2018

Actionable insights from your JDE usage data

I’ve blogged about ERP analytics a lot, I know – it gets a bit boring.  But I’m trying to change that.

Fusion5 have been working on the next level of insights using Google data studio – which is NEXT level in terms of reporting!

Take a look at this:


image

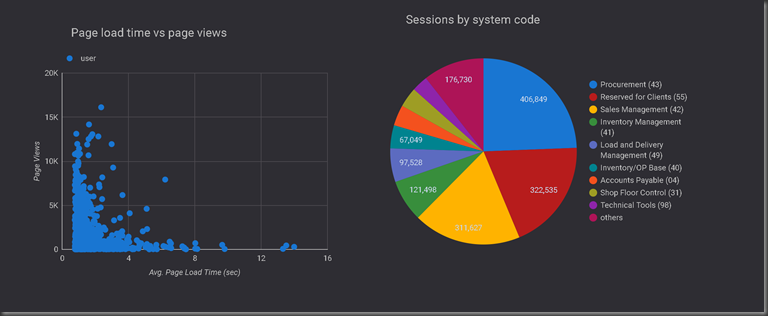
We are able to sort access by system code and tell clients what modules they are using the mod, and also look at individual scatter diagrams of page load times vs. page views – always looking for the outlying dots – what is going wrong?


image

The above show number of sessions mapped against page views for a period of time.  We look out for user ID sharing for those users that are logging in 100’s of times for a 24 day period!


image

We can finally sort out the debate about the best browser, seems that chome is the fastest one at this site, well – looking at the last 1.3 million page loads!

Although this is only the beginning.

We’ve written a custom connector that allows us to connect to the data from within JD Edwards – from data studio.  We are using AIS server data requests for this.

How?  This is how

1.  connect to JD Edwards using the custom JDE connector:

image


Then complete the details in the helper

image

And now you can see all of the fields for the table you chose:

image

You can choose the fields that you want on the report.
image

Great, now we start reporting

image

We can drag and drop data to get a dashboard view of the data in JDE – Awesome.

Here is some hard work that I did on the W@SJ tables:

image

So we can see what jobs are being run, what queues they are running in and also a scatter chart of rows processed vs average runtime, this is very helpful when determining performance.  You can choose to view this data by queue, user or job if you need to.


If you want a beta copy of our connector – get in contact!

Thursday, 1 November 2018

A JDE Mobile application that you can nerd love?

Do you have the acronym CNC in your resume?  
Do you own a mobile phone?  

Then this post is for you!

My amazing team at Fusion5 have created the first release of our JDE server manager mobile application.

You should be able to find it on the playstore soon, watch this space.

When we are live, you just search for Fusion5 mobile manager.

It's plugging into the rest services from server manager and giving you a nice mobile interface to do something with them.

Have you had a client (or users) ring you and say they've just changed the period or changed some company constants and you need to put your pint down and login on the laptop - no need to do this anymore!

Just pull your phone out and clear the cache.

We hope to update this with more down the track - starting and stopping and user counts.


JDE Clear cache, look for the big 5!
it remembers the last server and the cache

you configure your SM link, either internal or external, your MDM can work out the VPN if needed

Choose the servers that you want to reset cache for.  You can see the status too

Choose the cache

Tells you that things are okay

Augmented with ERP analytics, you can get the following view too
ERP analytics information available for how many users are currently logged in and the performance that they are getting on average.  This is JDE users that have been active in the last 5 minutes.

We can see the devices that ppl are using and also the pages that they are running on the mobile.

Look at the busy times of day to see when JDE is getting used the most.


Extending JDE to generative AI