This starts to get pretty complex pretty quickly.
We’ve noticed that a JDE web install on Azure feels slow, something feels wrong.
You coad load up 20 users with OATS and watch weblogic 12.2.1.2.0 start to slow down
Actually, speed is not the problem, the machine grinds to a halt with CPU usage.
We are using a super simple JD Edwards test, just basic navigation around P01012 and WSJ. Could not get easier – you’d think
The machine is on struggle street.
We are seeing the GC’s on the machine:
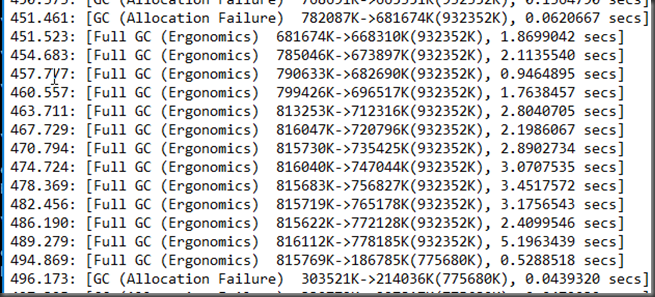
Look at the GC’s!
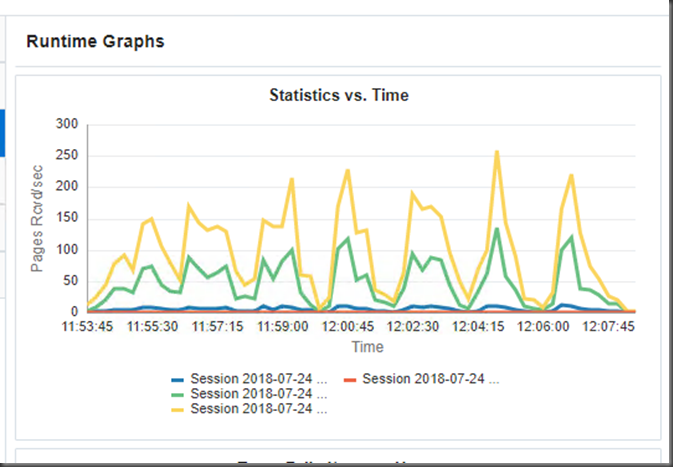
Too bouncy. This is 25 users doing the same thing and logging in at different times. There should be completely flat lines.
Wow, we are getting a full GC which is a total lockup of the JVM pretty much ALL of the time. Taking up to 9 seconds at times.
We need to get a fix for this.
What you quickly learn about GC in JVM’s is that there are 10000 parameters and without knowing how the objects are allocated by JDE, JDBC etc it’s hard to know which levers you should be pulling.
The tip here it, what levers is java pulling by default?
Let’s find out.
create a file called hello.java and paste in the following:
public class hello {
public static void main(String[] args) {
// Prints "Hello, World" to the terminal window.
System.out.println("Hello, Garbage");
}
}
Then javac hello.java
Do this from the jdk that is running your JVM. you might need to ps or task manage your way to finding this part of the command line.
C:\Program Files\Java\jdk1.8.0_162\bin>javac hello.java
C:\Program Files\Java\jdk1.8.0_162\bin>java -Xloggc:c:/GC/%t_gclogger.log -XX:+PrintGC -XX:-PrintGCDetails hello
Hello, Garbage
You are telling java to be verbose and print you what it’s starting with, nice.
So now you can goto c:\GC and find out what (windows 2016 in my case) is defaulted to run with java
Java HotSpot(TM) 64-Bit Server VM (25.162-b12) for windows-amd64 JRE (1.8.0_162-b12), built on Dec 19 2017 20:00:03 by "java_re" with MS VC++ 10.0 (VS2010)
Memory: 4k page, physical 16776756k(7382136k free), swap 20970920k(5873592k free)
CommandLine flags: -XX:InitialHeapSize=268428096 -XX:MaxHeapSize=4294849536 -XX:+PrintGC -XX:-PrintGCDetails -XX:+PrintGCTimeStamps -XX:+UseCompressedClassPointers -XX:+UseCompressedOops -XX:-UseLargePagesIndividualAllocation -XX:+UseParallelGC
So this is the naked truth for what the windoze JVM thinks that it should start with.
you can find all of the options listed here http://www.oracle.com/technetwork/java/javase/tech/vmoptions-jsp-140102.html
Using this iknowledge for JDE WLS is easy, at least you are going to know what the default params are. The other nice this is that if you enable verbose GC logging, you’ll be able to check the JVM history nice and easy
Java HotSpot(TM) 64-Bit Server VM (25.92-b14) for windows-amd64 JRE (1.8.0_92-b14), built on Mar 31 2016 21:03:04 by "java_re" with MS VC++ 10.0 (VS2010)
Memory: 4k page, physical 16776756k(11436092k free), swap 20970920k(14323404k free)
CommandLine flags: -XX:+AggressiveOpts -XX:InitialHeapSize=2147483648 -XX:MaxHeapSize=2147483648 -XX:+PrintGC -XX:-PrintGCDetails -XX:+PrintGCTimeStamps -XX:+TraceClassLoading -XX:+TraceClassResolution -XX:+UseCompressedClassPointers -XX:+UseCompressedOops -XX:-UseLargePagesIndividualAllocation -XX:+UseParallelGC
9.772: [GC (Metadata GC Threshold) 356941K->37709K(2010112K), 0.0497603 secs]
9.822: [Full GC (Metadata GC Threshold) 37709K->36962K(2010112K), 0.1157298 secs]
12.303: [GC (Metadata GC Threshold) 104455K->51591K(2010112K), 0.0146142 secs]
12.318: [Full GC (Metadata GC Threshold) 51591K->32982K(2010112K), 0.0572060 secs]
12.490: [GC (System.gc()) 56999K->33214K(2010112K), 0.0015203 secs]
12.492: [Full GC (System.gc()) 33214K->23886K(2010112K), 0.1942664 secs]
24.818: [GC (Metadata GC Threshold) 518419K->68032K(2010112K), 0.0430348 secs]
24.862: [Full GC (Metadata GC Threshold) 68032K->66171K(2010112K), 0.2901091 secs]
77.256: [GC (Allocation Failure) 590971K->231300K(2010112K), 0.1385489 secs]
85.555: [GC (Allocation Failure) 756100K->287925K(1813504K), 0.1240276 secs]
88.482: [GC (Allocation Failure) 616117K->264082K(1911808K), 0.0430451 secs]
91.890: [GC (Allocation Failure) 592274K->262682K(1938944K), 0.0406183 secs]
95.013: [GC (Allocation Failure) 633882K->264546K(1927680K), 0.0386120 secs]
97.406: [GC (Allocation Failure) 635746K->261578K(1955840K), 0.0398701 secs]
104.722: [GC (Metadata GC Threshold) 564677K->278930K(1948672K), 0.0511449 secs]
104.773: [Full GC (Metadata GC Threshold) 278930K->126063K(1948672K), 0.2996287 secs]
271.829: [GC (Allocation Failure) 535151K->179467K(1964032K), 0.0409892 secs]
1712.011: [GC (Allocation Failure) 606987K->143383K(1958912K), 0.0272208 secs]
2124.193: [GC (Allocation Failure) 570903K->188328K(1969152K), 0.0613237 secs]
2130.849: [GC (Allocation Failure) 624552K->211110K(1962496K), 0.0687304 secs]
2140.347: [GC (Allocation Failure) 647334K->246768K(1937920K), 0.1185877 secs]
2145.322: [GC (Allocation Failure) 655856K->299962K(1952256K), 0.1423171 secs]
2152.052: [GC (Allocation Failure) 709050K->347231K(1825280K), 0.1426725 secs]
2153.875: [GC (Metadata GC Threshold) 460486K->366841K(1845248K), 0.1227049 secs]
2153.997: [Full GC (Metadata GC Threshold) 366841K->275362K(1845248K), 1.1694144 secs]
2158.558: [GC (Allocation Failure) 557474K->297258K(1872384K), 0.0199824 secs]
2161.004: [GC (Allocation Failure) 547626K->304734K(1872896K), 0.0478987 secs]
2165.078: [GC (Allocation Failure) 555102K->336275K(1885696K), 0.0419868 secs]
2167.680: [GC (Allocation Failure) 602515K->398773K(1875968K), 0.1051175 secs]
2171.856: [GC (Allocation Failure) 665013K->435986K(1853440K), 0.1449460 secs]
2175.736: [GC (Allocation Failure) 677138K->464323K(1828352K), 0.1165887 secs]
2180.276: [GC (Allocation Failure) 705475K->492642K(1864192K), 0.1381040 secs]
2183.488: [GC (Allocation Failure) 725602K->511599K(1864192K), 0.1451506 secs]
2187.965: [GC (Allocation Failure) 744559K->535714K(1864192K), 0.1557600 secs]
2191.799: [GC (Allocation Failure) 768674K->549443K(1864192K), 0.1302633 secs]
2195.937: [GC (Allocation Failure) 782403K->576326K(1864192K), 0.1069931 secs]
2198.253: [GC (Allocation Failure) 809286K->594966K(1864192K), 0.0552789 secs]
2201.184: [GC (Allocation Failure) 827926K->614134K(1864192K), 0.0333154 secs]
I still have this to deal with for 20 users:
Wish me luck!


2 comments:
Have you been facing this with other WLS? I have WLS 12.1.3 running HTML with 4G (! yea, recommendation based on running UDO's) and the CPU load is fairly OK. I have seen peak GC duration of about 12 secs(!), bit of a bother, but most times, GC's are quick.
I'm going to post on fine tuning the fine tuning soon. I think I have some optimal settings for this client and my load testing. I've never had this much of an issue before, though most of my work has been on linux... Oh I love linux!
Post a Comment