Thursday, 25 August 2016

This is a simple guide to help me next time I need to start VM’s on an ODA.

This post started life as a description of oakcli commands and where to run them. Pretty simple… It ended up with me really trying to understand the virtualised ODA architecture and where it might be letting me down.

All my research came down to a couple of salient facts:

· Start and stop VM’s from oakcli on ODA_BASE

· Start and stop ODA_BASE from Dom0

First, you should do with through EM12C if you can, but I had a pile of problems with that too.

So, you need to use oakcli – nice…  go old school on it

oakcli is a command that seems to do anything for your VM’s on your ODA.

A good reference is here:  https://docs.oracle.com/cd/E22693_01/doc.12/e55580/oakcli.htm

Before you start hacking away, it’s nice to understand what you are dealing with when you have a virtualized ODA.

What are all these machines?

clip_image002

image

Each “Dom X” is a VM, where Dom0 is the management domain and Dom 1 is the ODA_BASE domain (a Dom U with special privs). All of these Dom’s sit above the hypervisor.

clip_image009

Each node is a physical machine

So, you’ve probably called your host – ronin… After the singer!

Dom0 gives you control over the hypervisor (ronin0_net1)

Dom1 is ODA_BASE (which is a glorified Dom U), it has direct access to the storage shelf.

Dom U is user domains, for each VM essentially

clip_image011

Then you have ronin0 and ronin1 which are hostnames for each of the ODA_BASE machines on your physical “ronin” ODA. You then have hypervisors (essentially another VM) known as ronin0_net1 and ronin1_net1.

Oakcli from Dom0

So you need to login as root to ronin0_net1 to use the oakcli command interface:

which oakcli

/opt/oracle/oak/bin/oakcli

if you are in Dom0, you have a limited number of objects for oakcli, but you still have the same command:

[root@ronin1-net1 ~]# oakcli show oda-base Usage: oakcli [] : [show | configure | deploy | start | stop | restart | create | delete]: [firstnet | additionalnet | ib2fiber | oda_base | env_hw | vlan | network] []: [force] []: [-changeNetCard | -publicNet] available with configure network

[root@buttons-net1 ~]# oakcli show oda_base
ODA base domain
ODA base CPU cores      :8
ODA base domain memory  :384
ODA base template       :/OVS/oda_base_12.1.2.5.tar.gz
ODA base vlans          :['net1', 'net2']
ODA base current status :Running

Oakcli from ODA_BASE

You get a few more options from ODA_BASE, you can actually control your VMs. Now, this is strange, as the Dom0 machine actually has them running within it… Very strange to me.

So, when you are on ODA_BASE, you can run vm commands:

[root@ronin0 tmp]# oakcli show vm

         NAME                                  NODENUM         MEMORY          VCPU            STATE           REPOSITORY

        bear                                    1               8192M              2            ONLINE          jderepotst
        chinapeak                               0               8192M              2            ONLINE          jderepotst
        georgetown                              0               8192M              2            ONLINE          jderepotst
        homewood                                0               8192M              2            ONLINE          jderepotst
        jdessosvr                               0               4096M              2            ONLINE          jderepotst
        mountshasta                             1               8192M              2            ONLINE          jderepotst

Note also that the database and grid run in ODA_BASE too:

oracle   57905     1  0 Apr15 ?        00:55:14 ora_ckpt_JDETEST1
oracle   57909     1  0 Apr15 ?        00:18:57 ora_smon_JDETEST1
oracle   57913     1  0 Apr15 ?        00:01:06 ora_reco_JDETEST1
oracle   57917     1  0 Apr15 ?        00:35:03 ora_mmon_JDETEST1
oracle   57921     1  0 Apr15 ?        06:05:21 ora_mmnl_JDETEST1
oracle   57925     1  0 Apr15 ?        00:01:33 ora_d000_JDETEST1
oracle   57929     1  0 Apr15 ?        00:01:27 ora_s000_JDETEST1
oracle   58081     1  0 Apr15 ?        06:44:49 ora_lck0_JDETEST1
oracle   58089     1  0 Apr15 ?        00:06:48 ora_rsmn_JDETEST1
oracle   58287     1  0 Apr15 ?        00:02:24 ora_arc0_JDETEST1
oracle   58291     1  0 Apr15 ?        00:03:50 ora_arc1_JDETEST1

See above there are a heap of processes for the JDETEST1 RAC instance of the database

When logged into Dom0, you actually see the ODA_BASE VM and the other VM’s if you PS for a command.

Note also that your VM’s don’t run in ODA_BASE, they run in Node 0

[root@ronin1-net1 ~]# ps -ef | grep domain
root      6590 10362  0 21:38 pts/2    00:00:00 grep domain
root     15970 15027  0 Mar04 ?        04:58:17 /usr/lib64/xen/bin/qemu-dm -d 1 -domain-name oakDom1 -videoram 4 -vnc 0.0.0.0:0 -vncunused -vcpus 16 -vcpu_avail 0xffff -boot c -serial pty -acpi -net none -M xenfv
root     31107 15027  2 16:26 ?        00:08:16 /usr/lib/xen/bin/qemu-dm -d 7 -domain-name bear -videoram 4 -vnc 0.0.0.0:10 -vncunused -vcpus 2 -vcpu_avail 0x3L -boot c -acpi -usbdevice tablet -net none -M xenfv
root     49452 15027  2 Apr07 ?        3-17:47:50 /usr/lib/xen/bin/qemu-dm -d 5 -domain-name mountshasta -videoram 4 -vnc 0.0.0.0:10 -vncunused -vcpus 2 -vcpu_avail 0x3L -boot c -acpi -usbdevice tablet -net none -M xenfv

Note that an interesting point is that the first vm above is actually ODA_BASE or oakDom1.  So the _net1 is the bare metal host.

If you run this command from the dom0 on the other node,

[root@ronin0-net1 ~]# ps aux |grep domain

root 5674 2.5 0.0 64744 2944 ? SLl Aug01 876:22 /usr/lib/xen/bin/qemu-dm -d 16508 -domain-name chinapeak -videoram 4 -vnc 0.0.0.0:10 -vncunused -vcpus 2 -vcpu_avail 0x3L -boot c -acpi -usbdevice tablet -net none -M xenfv

root 15964 0.2 0.0 56552 996 ? SLl Mar04 573:03 /usr/lib64/xen/bin/qemu-dm -d 1 -domain-name oakDom1 -videoram 4 -vnc 0.0.0.0:0 -vncunused -vcpus 16 -vcpu_avail 0xffff -boot c -serial pty -acpi -net none -M xenfv

root 39236 0.0 0.0 61208 736 pts/5 S+ 22:38 0:00 grep domain

root 60399 4.0 0.1 64744 5100 ? SLl Apr07 8210:40 /usr/lib/xen/bin/qemu-dm -d 12 -domain-name georgetown -videoram 4 -vnc 0.0.0.0:10 -vncunused -vcpus 2 -vcpu_avail 0x3L -boot dc -acpi -usbdevice tablet -net none -M xenfv

root 61443 2.6 0.0 64744 956 ? SLl Apr07 5231:00 /usr/lib/xen/bin/qemu-dm -d 13 -domain-name homewood -videoram 4 -vnc 0.0.0.0:10 -vncunused -vcpus 2 -vcpu_avail 0x3L -boot c -acpi -usbdevice tablet -net none -M xenfv

You see another ODA_BASE (of course, because we are running RAC), but you see a different list of Dom0’s

This is a great diagram of how disk works for OVM guest OS’s on the ODA:

clip_image013

What a mess! The hypervisor exposes disk to ODA_BASE a little more natively, but VM disks are exposed as a NFS share to an ACFS volume. The above is stolen from http://blog.dbi-services.com/oda-vms-possibilities-a-performances/ . So you have VMs running on the hypervisor which are stored on an NFS share itself exported by a VM……not the most efficient architecture.

Performance comparison ODA vs. AS/400 part 2

I wrote recently on comparing performance between a new platform and an old platform previously (here).  Note that this was comparing an OLD AS/400 with a new engineered appliance. This blog entry was a method by which you might be able to simulate a similar batch load on your new platform without having all of the users connected.

The article showed you how to generate the command line commands for running the batch load on your new enterprise server, create a script and away you go.

I ran this 5 times on the new platform and then gathered statistics from F986114 of both environments so that I could do an accurate comparison of the performance.

I cheated a little bit, despite having database links to the AS/400, I decided to do some number crunching in EXCEL.

clip_image002[4]

Above is what the spreadsheet looked like at the end of the day. There are a couple of important elements that I’d like to explain.

I’m going to use some real world numbers, but also abstract the client from this post. I hope I do a good job.

I found that there were 800+ unique jobs that took more than 1500 seconds to run, so this was a really good workload to send to the new batch server.

When comparing the performance I needed to add an additional dimension to the data – which was rows processed. I needed this further dimension, as if the jobs where not processing a similar amount of rows (for the main loop), then the compare is pointless. I decided to only compare batch jobs that processed a workload that was within 20% of each other.

The above filtering gave me a unique list of 221 jobs that processed a workload that was within 20% of the original amount.

Great, so this is a pretty good amount. I can compare the runtime of 221 distinct and unique real world batch jobs between the old system and the new system and see, on average, which was faster or slower.

I don’t want to let any cat’s out of the bag, but in the situation I was testing I saw that the replacement server was 2.7 times slower on average. Wow, there is some significant tuning to complete to get this thing singing.

There are lots of things that need further analysis and justification, so please don’t just assume that the replacement hardware that I’ve hinted to above is slow, by no means this is the case – it’s great. Perhaps just not as great as what it needs to be to replace a monster AS/400.

I’m going to continue the analysis, but the jury is out for the particular configuration that has just been tested.

alter session set global_names = FALSE;

SELECT JCPID as INNERPID, JCVERS as INNERVERS, simd || vrjd, count(1) as INNERCOUNT, Avg(86400*(JCETDTIM-JCSTDTIM)) as INNERAVERAGE, min(86400*(JCETDTIM-JCSTDTIM)) AS INNERMIN, max(86400*(JCETDTIM-JCSTDTIM)) AS INNERMAX, avg(jcpwprcd) as "ROWS PROCESSED"from svm900.f986114@youras400.com t1,ol900.f9860@youras400.com,copd900.f983051@youras400.com, svm900.f986110@youras400.com t2where trim(t1.jcpid) = trim(siobnm) and trim(t1.jcvers) = trim (vrvers) and trim(t1.jcpid) = trim (vrpid)and t1.jcjobnbr=t2.jcjobnbrand t1.jcexehost = 'YOURAS400'group by 'runube JDE JDE PY900 *ALL ' || JCPID || ' ' || JCVERS || CASE WHEN jcjobque IS NULL THEN N'QBATCH' WHEN jcjobque = ' ' THEN N'QBATCH' ELSE jcjobque END || ' Batch Hold Save', t1.jcpid, JCVERS, simd || vrjd having Avg(86400*(JCETDTIM-JCSTDTIM)) > 15 and Avg(86400*(JCETDTIM-JCSTDTIM)) < 15000;

The above SQL will give you a list of jobs that took longer than 150 seconds to process on the AS/400.

SELECT JCPID as INNERPID, JCVERS as INNERVERS, simd || vrjd,

count(1) as INNERCOUNT,

Avg(86400*(JCETDTIM-JCSTDTIM)) as INNERAVERAGE,

min(86400*(JCETDTIM-JCSTDTIM)) AS INNERMIN,

max(86400*(JCETDTIM-JCSTDTIM)) AS INNERMAX, avg(jcpwprcd) as "ROWS PROCESSED"

from svm900.f986114,ol900.f9860@jdeprod_dblink, py900.f983051

where trim(jcpid) = trim(siobnm) and trim(jcvers) = trim (vrvers) and trim(jcpid) = trim (vrpid)

and JCETDTIM < TO_DATE('25082016','DDMMYYYY') and JCETDTIM > TO_DATE('01062015', 'DDMMYYYY')

group by jcpid, JCVERS, simd || vrjd ;

Above is to get the results of all batch jobs processed on the linux server for compare.

clip_image004[4]

Above is a graphical compare of the old and the new. The old server runtime is in blue.

Hmm, more tuning needed

Tuesday, 23 August 2016

Are your media objects getting you down?

Media objects can get large and painful, I’ve seen many sites with 100+GB of MOs – some of which will never be used again.

At Myriad we develop lots of mobile applications, of course this allows users to attach as many pictures as they want to JDE transactions, and this does cause a bit of bloat.  Our devices natively want to write 12MP files to the MO’s.  This add up, so we have developed a solution that ensures that you don’t lose quality but also don’t use too much expensive storage.

Firstly, we have a automatic job that compresses all of the photos that have been attached as media objects.  This is a fairly simple job that has access to the MO queue.  It then writes a new entry to the F00165 table and points this to a URL which references an S3 bucket – which has the original high quality image.  We have some special referrer security on the bucket policy that only allows access from certain referrers. 

So, each image is ripped to 1024x768 automatically – nice! This looks better when using JD Edwards or reports now, or anything that reports and attempts to display these large attachments.  Our location that stores media objects (deployment server out of the box), is not bogged down with massive attachments – they are all in a very inexpensive S3 bucket.

No quality is lost, as you have a link to the original image.

So, this gives your MOs 11x9 of storage durability…  You can restart your dep server at any time, objects are accessed as S3 objects which are stored in your (or OUR!) secure AWS account and location.

Q: How durable is Amazon S3?

Amazon S3 Standard and Standard - IA are designed to provide 99.999999999% durability of objects over a given year. This durability level corresponds to an average annual expected loss of 0.000000001% of objects. For example, if you store 10,000 objects with Amazon S3, you can on average expect to incur a loss of a single object once every 10,000,000 years. In addition, Amazon S3 is designed to sustain the concurrent loss of data in two facilities.

As with any environments, the best practice is to have a backup and to put in place safeguards against malicious or accidental users errors. For S3 data, that best practice includes secure access permissions, Cross-Region Replication, versioning and a functioning, regularly tested backup.

If you would like a neat solution like this to take away your MO-woes, get in contact.

You don’t need to be on AWS for all of this to work.  Note that we are thinking of an extension that uses https://aws.amazon.com/workdocs/ to index and make this content drill back into JDE – watch this space.

Friday, 12 August 2016

JD Edwards performance–How do you stack up?

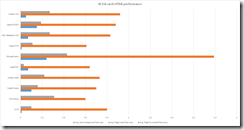
We’ve installed our google analytics plugin to a number of sites, here is an interesting cross section of average performance metrics that we are able to attain.  these are all high level.  We could do this analysis on particular applications, particular users or time of day – the options are endless.

This is a large aggregated overall summary of performance for 10 different JDE sites.  All anonymous – except our demo site.

image

This is based on the data below.  Note that google analytics is able to differentiate between the server time and the page load time.  This is an interesting distinction which makes a large different in how you tune an application.

image

The chart above shows server time, page load time and page download time, all very interesting

image

If you want to see this type of analysis for your site, get sent a weekly summary and more – get in contact.

Wednesday, 10 August 2016

compare my AS/400 and oracle performance for JD Edwards–how to?


I want to simulate some batch activity quickly, so this is what I’m going to do.

Firstly, my new system is an ODA and my old system is an iSeries.  Yes, I think they are dying off now.

I need to get a good cross section of batch activity from the 400 and run this on the ODA, no problems.  I use some of the scripts that I’ve previously posted over the F986114 et al to get a selection of jobs that on average took longer than 15 seconds to run.  You can see the query below.  So I have 884 unique job|version combinations from my AS/400 that I’m going to run on the ODA.

I’m then going to summarise the average job runtimes to see what is going on.

I appreciate that this is not an exact science, when looking at the differences – I’m going to look at the F986114A to see how many rows were processed, therefore being able to compare the results with a little more certainty.

SELECT 'runube JDE JDE PY910 *ALL ' || JCPID || ' ' || JCVERS ||
CASE  WHEN jcjobque IS NULL THEN N'QBATCH' WHEN jcjobque = ' ' THEN N'QBATCH' ELSE jcjobque END  || ' Batch Hold Save',
  t1.JCPID as INNERPID, t1.JCVERS as INNERVERS, simd || vrjd,
  count(1) as INNERCOUNT,
  Avg(86400*(JCETDTIM-JCSTDTIM)) as INNERAVERAGE,
  min(86400*(JCETDTIM-JCSTDTIM)) AS INNERMIN,
  max(86400*(JCETDTIM-JCSTDTIM)) AS INNERMAX
from svm900.f986114@purgatory.fp.co.nz t1,ol900.f9860@purgatory.fp.co.nz, copd900.f983051@purgatory.fp.co.nz, svm900.f986110@purgatory.fp.co.nz t2
where trim(t1.jcpid) = trim(siobnm)
and trim(t1.jcvers) = trim (vrvers)
and trim(t1.jcpid) = trim (vrpid)
and t1.jcjobnbr=t2.jcjobnbr
group by 'runube JDE PASSWORD PD910 *ALL ' || JCPID || ' ' || JCVERS ||
CASE  WHEN jcjobque IS NULL THEN N'QBATCH' WHEN jcjobque = ' ' THEN N'QBATCH' ELSE jcjobque END  || ' Batch Hold Save', t1.jcpid, JCVERS, simd || vrjd having Avg(86400*(JCETDTIM-JCSTDTIM)) > 15;

This SQL created 884 of these, which I then just pasted into the command line, note that the second JDE is the “password”

runube JDE JDE PY900 *ALL R03B50     S0002     FPSLIK     Batch Hold Save
runube JDE JDE PY900 *ALL R03B50     S0001     FPSLIK     Batch Hold Save
runube JDE JDE PY900 *ALL R03B500X   F5001     JDEBATCH2  Batch Hold Save
runube JDE JDE PY900 *ALL R56202     S1501     COSTING2   Batch Hold Save
runube JDE JDE PY900 *ALL R03B571    F5000     JDEBATCH   Batch Hold Save
runube JDE JDE PY900 *ALL R42800     S1709     EODFIN     Batch Hold Save
runube JDE JDE PY900 *ALL R42800     S1707     EODFIN     Batch Hold Save

That is totally cool.

I turned off the SMTP server in the [MAIL] section of the JDE.INI – just in case it was sending emails to approve orders that some batch job is creating.


imageIO stats

imageonly 4 cores enabled

imageThis is the enterprise server, getting hammered

imageIO on the batch server

The next couple of posts are going to be the mechanics of comparison

Thursday, 4 August 2016

Determining my IOPS need when planning Oracle RDS in AWS

When provisioning a database in AWS, an RDS database that is.  You must carefully look into your IOPS requirements.

Why,  well let me give you a hint  --> $$$$$$$

A classic line from AWS is – you pay for what you use – period!

So, the more IOPS you provision – the more that you will pay.

For example, in Sydney for a single AZ deployed database, you will pay:

Storage Rate
$0.138 per GB-month

Provisioned IOPS Rate
$0.11 per IOPS-Month

So, if I want 3000 IOPS, this is going to cost 3000x.11 per month.  or 330 bucks a month for guaranteed IOPS.  + my storage usage

How many IOPS do I need, well you could try this:  https://d0.awsstatic.com/whitepapers/determining-iops-needs-for-oracle-database-on-aws.pdf which is cool, but comes down to your writing some SQL:

CREATE TABLE peak_iops_measurement (capture_timestamp date,
total_read_io number, total_write_io number, total_io number,
total_read_bytes number, total_write_bytes number, total_bytes
number);


DECLARE
run_duration number := 3600;
capture_gap number := 5;
loop_count number :=run_duration/capture_gap;
rdio number;
wtio number;
prev_rdio number :=0;
Prev_wtio number :=0;
rdbt number;
wtbt number;
prev_rdbt number;
Prev_wtbt number;
BEGIN
FOR i in 1..loop_count LOOP
SELECT SUM(value) INTO rdio from gv$sysstat
WHERE name ='physical read total IO requests';
SELECT SUM(value) INTO wtio from gv$sysstat
WHERE name ='physical write total IO requests';
SELECT SUM(value)* 0.000008 INTO rdbt from gv$sysstat
WHERE name ='physical read total bytes';
SELECT SUM(value* 0.000008) INTO wtbt from gv$sysstat
WHERE name ='physical write total bytes';
IF i > 1 THEN
INSERT INTO peak_iops_measurement (capture_timestamp,
total_read_io, total_write_io, total_io, total_read_bytes,
total_write_bytes, total_bytes)
VALUES (sysdate,(rdio-prev_rdio)/5,(wtio-prev_wtio)/5,((rdioprev_rdio)/5)+((wtio-prev_wtio))/5,(rdbt-prev_rdbt)/5,(wtbtprev_wtbt)/5,((rdbt-prev_rdbt)/5)+((wtbt-prev_wtbt))/5);
END IF;
prev_rdio := rdio;
prev_wtio := wtio;
prev_rdbt := rdbt;
prev_wtbt := wtbt;
DBMS_LOCK.SLEEP(capture_gap);
END LOOP;
COMMIT;
EXCEPTION
WHEN OTHERS THEN
ROLLBACK;
END;
/

This is cool, but you need to wait days…  It’ll sit there chugging too.

Of course, you could just use:

select METRIC_NAME,avg(AVERAGE) as "Value", max(average) as maxval
   from dba_hist_sysmetric_summary
   where METRIC_NAME in ('Physical Read Total IO Requests Per Sec','Physical Write Total IO Requests Per Sec')
   group by METRIC_NAME;

Which will give you something like:

METRIC_NAME                                                      Value                  MAXVAL                
---------------------------------------------------------------- ---------------------- ----------------------
Physical Write Total IO Requests Per Sec                         38.47016094280773108458390177353342428377 1616.23477993026      
Physical Read Total IO Requests Per Sec                          140.575645080103957442019099590723055935 2946.16113345313
      

Wow, that is pretty neat – pretty much exactly what I want.  Note that this is the total AVERAGES for ever.  If you want some more information, you could graph the details in the results based upon the snap_id:

Get the snapshot information:

select * from dba_hist_snapshot;
 

Get the statistics per snap:


   select
  snap_id,
  metric_name "Metric Name",
  metric_unit "Metric Unit",
  minval "Minimum Value",
  maxval "Maximum Value",
  average "Average Value"
from
  DBA_HIST_SYSMETRIC_SUMMARY
where
       snap_id
        

For a totally RAD summary:

select t1.snap_id, t2.METRIC_NAME,t2.average, t2.metric_unit, t1.begin_interval_time
   from dba_hist_sysmetric_summary t2, dba_hist_snapshot t1
   where t2.METRIC_NAME in ('Physical Read Total IO Requests Per Sec','Physical Write Total IO Requests Per Sec')
   and t2.snap_id=t1.snap_id
   order by t2.snap_id desc;


image

Now, a much better view


select t2.maxval+t3.maxval ,t2.average + t3.average, t1.begin_interval_time
   from dba_hist_sysmetric_summary t2, dba_hist_snapshot t1, dba_hist_sysmetric_summary t3
   where t2.METRIC_NAME in ('Physical Read Total IO Requests Per Sec')
   and t3.METRIC_NAME = 'Physical Write Total IO Requests Per Sec'
   and t2.snap_id=t3.snap_id
   and t2.instance_number= t2.instance_number
   and t2.begin_time= t3.begin_time
   and t2.snap_id=t1.snap_id
   order by t2.snap_id desc;

Which produces the following

image

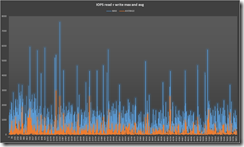
I would not use MAX, but trendline analysis.  These guys would probably be okay with 1500, but I’d make it 2000 IOPS.

Extending JDE to generative AI