I do a lot of performance testing with JD Edwards. It’s vital to record all of the machine “metrics” along with all of the test results. Why is this vital? So that when you run tests next time or when you want to check what the CPU / disk / memory was like under load – you can go back and check.
serverstats is the terminology that OATS has for this.
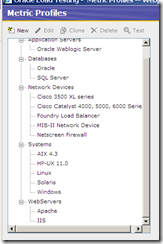
Above is the menu items under the server stats configuration menu.
There are many COOL prebuilt templates “metric profiles” for gathering vital performance statistics, but I’ve quite often needed a little more from a unix perspective.
Metrics
A screen of the metrics that make up a metric profile
An option that I love (because I love em12c [how’s that for nerdy passion]) is that OATs is smart enough to be able to hook into EM12C for performance metrics – that is terrific. Therefore setup enterprise manager as a datasource
But this is all nice to know, but not really meeting the title of my post… How to augment the pretty basic and INCORRECT list of linux counters that OATS gives you out of the box.
They are a little too basic (but work without the labyrinthine SNMP traps for performance – thank goodness!)
I want io information, I want all of the vmstat command
procs -----------memory---------- ---swap-- -----io---- --system-- -----cpu------
r b swpd free buff cache si so bi bo in cs us sy id wa st
0 0 303860 437712 248572 9278632 0 0 1 11 0 0 4 1 91 5 0
0 0 303860 437712 248572 9278632 0 0 0 26 520 1009 0 0 98 2 0
I want swap information, IO, system and CPU, so I need to create some custom metrics to record the information that I need.
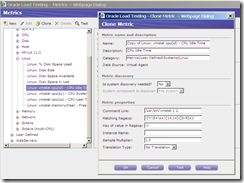
So clone an existing metric
Like the above. At the end of the day, the combination of the command line, regexp and key value items allow OATS to record a single numeric value that is coming back from the OS and record this at a user define time period.
There are a couple of issues with how Oracle define these:
Firstly their value for memory(free) is wrong, it’s actually mapped to (buff) on OEL. So they need to fix that.
Secondly the default counters are an average for 1 second taken every 5 seconds… Perhaps it should be a 5 second average taken every 5 seconds – especially when dealing with io counts and swap io counts… Does not matter so much for %ages.
So, if you wanted io in (in blocks), then ask for field 8, because the array starts at 0 for the perl regexp.
/(?:\S+\s+){8,8}([0-9]+)/
Everything else can stay the same, but now you have io – great!
Therefore, you can work through your list of columns and iostat options to create the values that you want graphed while you are running your performance tests, that was not hard now was it?
FIELD DESCRIPTION FOR VM MODE
Procs
0 r: The number of processes waiting for run time.
1 b: The number of processes in uninterruptible sleep.
Memory
2 swpd: the amount of virtual memory used.
3 free: the amount of idle memory.
4 buff: the amount of memory used as buffers.
5 cache: the amount of memory used as cache.
Swap
6 si: Amount of memory swapped in from disk (/s).
7 so: Amount of memory swapped to disk (/s).
IO
bi: Blocks received from a block device (blocks/s).
bo: Blocks sent to a block device (blocks/s).
System
in: The number of interrupts per second, including the clock.
cs: The number of context switches per second.
CPU
These are percentages of total CPU time.
us: Time spent running non-kernel code. (user time, including nice time)
sy: Time spent running kernel code. (system time)
id: Time spent idle. Prior to Linux 2.5.41, this includes IO-wait time.
wa: Time spent waiting for IO. Prior to Linux 2.5.41, included in idle.
st: Time stolen from a virtual machine. Prior to Linux 2.6.11, unknown.


No comments:
Post a Comment