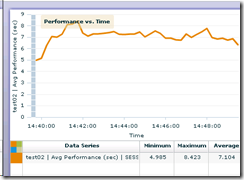
I thought that I’d provide some very generic guidelines for performance testing and JD Edwards 9.1. These figures can be used as a guide for your systems performance. If course, these tests and scenarios are very limited.
I have a scenario, 1 web server, 1 DB server, 1 app server. I log into E1, I launch AB, index search 1 record, close AB, open BV, run R0010P, close BV logout close browser.
I create a load test using Oracle Application Test Suite.
I configure all of my counters
I configure 20 concurrent users (to being with)
I choose to have 0 wait time, so I’m perf testing.
I run this scenario for 10 minutes.
What do you think the results might be?
| Name | Value | Min | Max | Avg |
| Transaction/s | .827 | .082 | 2.579 | 2.272 |
| Pages/s | 8.8 | .667 | 26.2 | 22.68 |
So these are very interesting stats. Each user is getting 1 page per second, Each user is getting 10 hits per second. Each user is generating 58KB/s.
I find the final item interesting, as this allows you to know exactly how much a very fast moving user is using on average for E1 – this is 0 wait time, so a user could not actually achieve this (none that I know).
Like I said, this is a 1 off very simple sample.
Oracle Application Testing Suite is fantastic and is exceptionally easy to use. Although, what you do not have (and I do) is the ability to compare values between sites and know where you can make considerable performance improvements!


No comments:
Post a Comment