- geographical, this is not just user counts, but looking into the modules and performance around the globe. This is perfect when looking for process improvements and measuring global initiatives that you put in place. Reporting like this helps you with internal billing too.
- license right size - you know who is using JDE, you know the modules and you know the locations and time being spent. This allows you to ensure that you are always compliant. Perhaps taking away access for users that use JDE 1 time a month - which could save you 1000s in compliance and license.
- Module usage in terms of location, number of users and programs being used... Which can turn into analysis of performance and engagement.

Looking at the above we have 1.1 million JDE page views in a month, we can see that this is generated by 1106 users in the same period. A large functional footprint in JDE (409 unique application being loaded) is being used over many modules and is a global footprint too. We can see that JDE usage is up a massive 10% as compared with the previous month, the customer must be busy. This is an amazing executive snapshot to understand exactly what JDE is doing for the customer and comparing that with the previous month.
This is also really handy, when you know more information. This is a cloud hosted client, so we are able to give complete costings for the platform on a user basis.

We are looking at about 60% usage of the previous sample data, with some limited international usage. We can see that the average page load time is 45% slower for this customer than the one above and twice as slow as the example below - so there might be some opportunities to make the user experience a little quicker. Note that this observation is only possible through the analysis of multiple data sets.
When looking for process improvement, let's focus on the highly used apps and talk to the users that use those apps the most. This is a simple task with all of the information above.

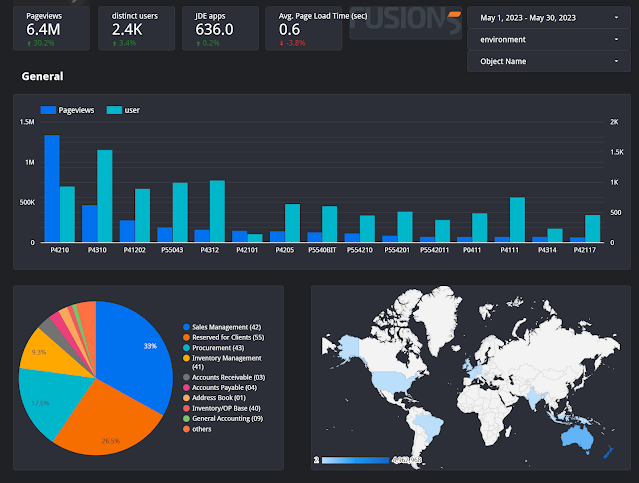
Okay, we are getting bigger, more complex and a lot faster! But wait, I do not want to spoil the surprise. We have more apps in use, more locations around the world and EVERY one of the 1.9 million pages in the last month being loaded in less than .8 of a second. Usage is up a massive 22% of the previous month. I can determine where this has come from, in terms of module and location - which is awesome for the business to see. They can justify the spend and improvements in the platform based upon actual data.

No comments:
Post a Comment