Tuesday, 14 August 2018

SQL Server miracles

I have not used SQL Server for ages, in fact – it’s been spotty throughout my career.

But, I was just doing some hectic Media Object massaging (F00165) – I’m converting them from type 1 (physical files) to type 5 HTML links.

My SQL caused a duplicate for a large insert, but look at what SQL tells me!!!

image

It tells me the bad record!!!

How many group by queries has this just saved me, so awesome.

Monday, 13 August 2018

Oracle SE2 license clarification for oracle technology foundation


I think it's really important to know your rights when it comes to database licensing and the cloud.

I'm only going to talk about the database here, that it to say - oracle SE2.

What can I do with SE2, are there going to be significant performance issues if I used SE2? Perhaps, or perhaps not...


Description of support for SE2:In September, 2015 Oracle announced the withdrawal of Oracle Database Standard Edition and the availability of a new product, Oracle Database Standard Edition 2. This announcement is relevant for all JD Edwards customers who have licensed Oracle Technology Foundation for JD Edwards EnterpriseOne because this product includes a limited use license for Oracle Database Standard Edition.In light of the new Oracle Database Standard Edition 2 product offering, Oracle Technology Foundation for JD Edwards EnterpriseOne has been updated to include a restricted use license of Oracle Database Standard Edition 2. Refer to the JD Edwards EnterpriseOne Licensing Information User Manual for a detailed description of the restricted use licenses provided in the Oracle Technology Foundation for JD Edwards EnterpriseOne product.


augmented with


Licence informationOracle Technology Foundation for JD Edwards EnterpriseOne may be licensed instead of EnterpriseOne Core Tools and Infrastructure for customers wanting the Oracle components but are not currently licensed for EnterpriseOne Core Tools and Infrastructure. The Oracle components included with Oracle Technology Foundation for JD Edwards EnterpriseOne are listed under "Entitled Products and Restricted User Licenses" below.Oracle Technology Foundation for JD Edwards EnterpriseOne would cover the JD Edwards EnterpriseOne Core Tools and Infrastructure prerequisite requirement.
Entitled Products and Restricted Use LicensesA license for Oracle Technology Foundation for JD Edwards EnterpriseOne includes the restricted-use licenses of: Oracle Database Standard Edition 2; Oracle Internet Application Server Standard Edition; Oracle WebLogic Server Standard Edition; JRockit JVM; Oracle Application Server Portal; Oracle WebCenter Services; Oracle BPEL Process Manager; Oracle Business Activity Monitoring; Oracle Application Server Single Sign-On; Oracle Access Manager Basic; Oracle Application Server Web Cache; and Business Intelligence Publisher (formerly XML Publisher).
As noted in the preceding paragraph, a license for Oracle Technology Foundation for JD Edwards EnterpriseOne includes a restricted-use license for Oracle Database Standard Edition 2. Oracle Database Standard Edition 2 may be used solely in conjunction with any and all JD Edwards EnterpriseOne programs licensed under your agreement, including third party programs licensed for use with JD Edwards EnterpriseOne programs. Oracle Database Standard Edition 2 may be installed on an unlimited number of processors. When used with Oracle Real Application Clusters, Oracle Database Standard Edition 2 may be installed on any number of RAC nodes. If you require features and functions beyond those included with the Oracle Database Standard Edition 2, or if you require use of Oracle Database beyond your JD Edwards EnterpriseOne implementation, you may purchase a non-limited use license by contracting directly with Oracle or one of its authorized distributors.
A license for Oracle Technology Foundation for JD Edwards EnterpriseOne also includes a restricted-use license for the following components of Oracle Fusion Middleware: Oracle Application Server Standard Edition or Oracle WebLogic Server Standard Edition (either of these products may be used, but both products cannot be used for the same function); Oracle Application Server Portal; Oracle WebCenter Services; Oracle BPEL Process Manager; Oracle Business Activity Monitoring; Oracle Application Server Single Sign-On; Oracle Access Manager Basic; Oracle Application Server Web Cache; and Business Intelligence Publisher. These components may be used solely in conjunction with any and all JD Edwards EnterpriseOne programs licensed under your agreement, including third party programs licensed for use with JD Edwards EnterpriseOne programs. These components may be installed on an unlimited number of processors. If you require use of these components beyond your JD Edwards EnterpriseOne implementation you may purchase a non-limited use license for any of the Oracle components by contracting directly with Oracle or one of its authorized distributors.
As noted in the preceding paragraph, a license for Oracle Technology Foundation for JD Edwards EnterpriseOne includes a restricted-use license for Oracle Business Intelligence Publisher. Oracle Business Intelligence Publisher may be used to create or modify reports that use the Oracle supplied database schema, or modifications to that schema done to support modifications to supplied Oracle JD Edwards EnterpriseOne programs. For the avoidance of doubt, examples of uses that are not permitted include, but are not limited to, the following: adding new reports that support different applications or database schemas other than JD Edwards EnterpriseOne.
Summary


Point 1: Oracle Database Standard Edition 2 may be used solely in conjunction with any and all JD Edwards EnterpriseOne programs licensed under your agreement

Q:  Does this mean things like DSI or reportsnow? I'm told YES


Point 2: Oracle Database Standard Edition 2 may be installed on an unlimited number of processors

Wow, so if you use RAC, you can have unlimited nodes for JDE with standard edition.

Point 3: Okay, you cannot used statistics and performance packs, that's a shame. But if you have a mature environment - you'll get away with it.

Point 4:
data-guard. RDS is pretty much looking after this for you (and all the complexity). They are maintaining and shipping your logs to a remote replica and doing all of the network aliasing behind the scenes. This is SO easy to implement.

AWS summary:

This is where things get a little exciting. Lets look at RDS options for Se2


AWS tells us (and I believe their lawyers have done the work), that they can commission a 16 way SE2 machine with BYOL. And as clearly stated about, you have BYOL for as many cores as you can point your SE2 at... but limited to 16 because SE2 does that.

You could be addressing 16 cores and 488 GB of RAM under your standard JD Edwards agreement. For a multi AZ deployment in this situation, you'd be paying approximately 12,000 US per month, but a more modest 16 way with 122GB of ram is 3500 a month - not bad. 

With my load testing experience in JDE, 16 cores goes a LONG way - you don't need parallel either for JDE (IMHO).

Remember that this is Highly available (without RAC), so you actually have two machines ready to process your requests if AWS lose an availability zone.


Above you can see all of the server classes that you can address for SE2.

I appreciate that oracle will probably have a different view on this and I recommend that you seek specific advice before acting on the above recommendation / opinion.


Wednesday, 8 August 2018

Load testing JD Edwards–some load testing tips from the field?

I’ve said it before and I’ll say it again, load testing must be one of my favourite and rewarding consulting gigs.  I really like it, probably revealing a little too much about myself here.

I like constantly pursuing bottlenecks and trying to give clients confidence that the changes are going to make a difference and that they are pushing their hardware and software to the limit – getting the best bang for buck.

The age old question is – how hard do you push?

Here are a couple of things that I live by when load testing:

  • choose everyday transactions – sales order entry, PO entry, address book find, launch a simple job.  Do not just hit the system with all of the slow and hard transactions, you are not going to test anything
  • Do not go to the end of large grids
  • know the type of transactions that you are performing, are they logic intensive or are they data intensive and understand their individual timings and more importantly their consistency.
  • get your users waiting more than 3 seconds per interaction with the browser, you would be surprised when you see actually how hard your JDE is hit
  • Include a mix of batch and interactive
  • make sure that you count records before and after so that you know transactions are hitting the database
  • make everything repeatable.  Add a PO, approve a PO, print a PO – so you do not run out of data
  • dates should be variables
  • Don’t start near the end of a month, you’ll have date problems and warning problems before you know it
  • Use OATS – it’s great for JDE load testing
  • get a specialist (like me) in to do the job.  It’s a tough gig to set this up and run it yourself.

But, back to the question, how many users?

Here are some stats that you may or may not believe.

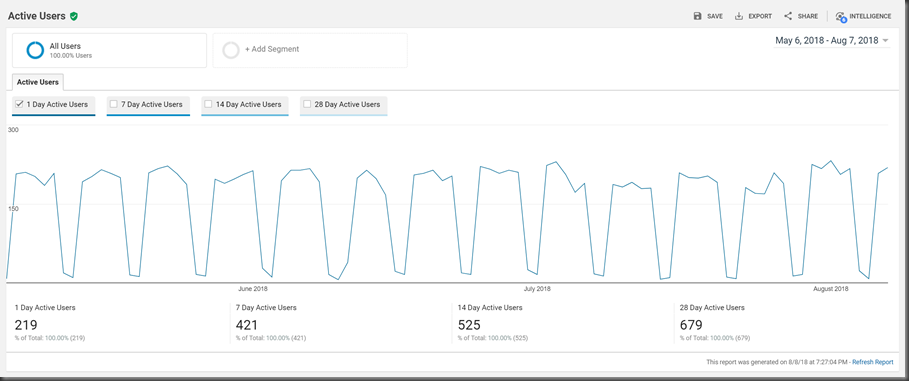
For a site that has about 400 active JDE users a week approximately.

image

This is cookie based.

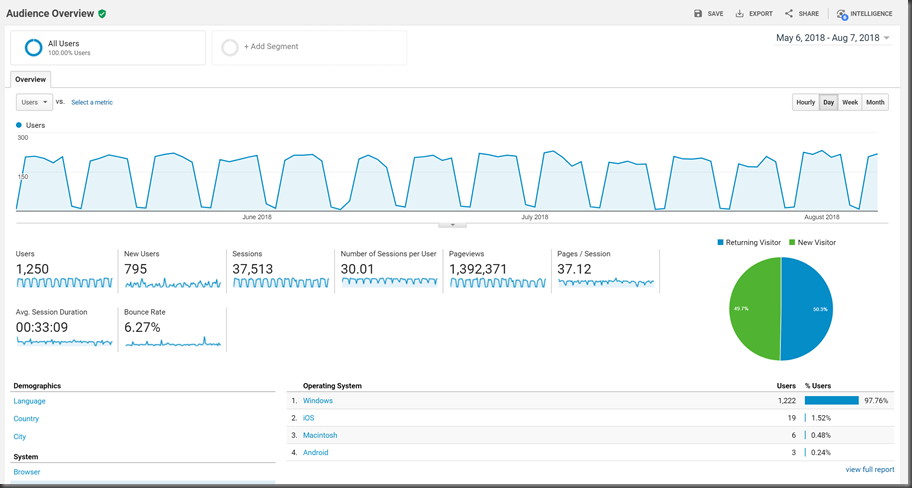
They’ve loaded 1.4 million pages and server over 37000 logins

image

Wait, that is cool, that means 37 pages per second – wait ERP analytics tells us this!

And we can see that the timeout is probably 30 minutes!

But, we can also tell the peak periods of usage.

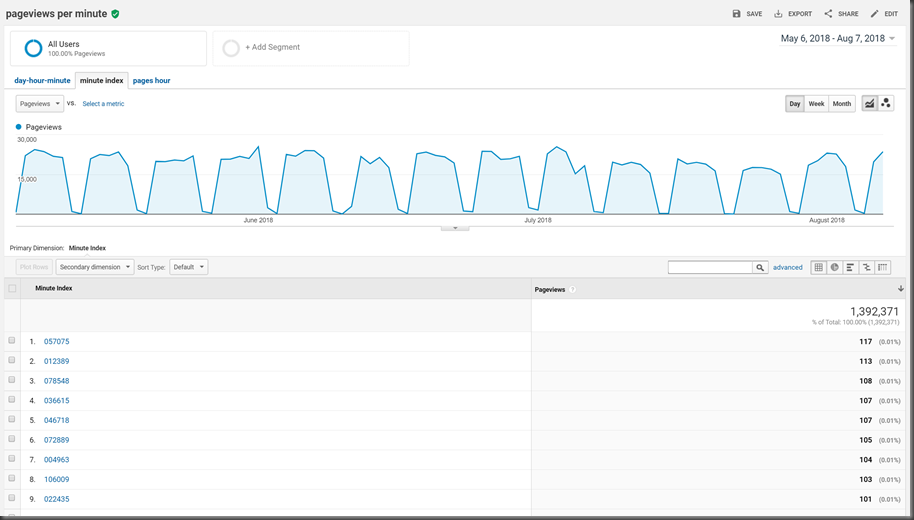
A simple custom report can tell me pageviews per minute, at a peak of 117

image

and pageviews per hour, at a peak of 3405

image


This is really good data for load testing.

If we looked at this basically we’d want to load test 1394000 million pages and try and divide out a value for # days, 10 hours a day etc etc…

1394000/13x5 (weeks work days)/10 hours per date = 2144 an hour – but the peak is 3405 using data (1.5 times the estimate)

Taking this to another level 2144/60=35 pages a minute, which is more than 3 times less than the peak!

Load testing for this client could take many different forms, but if I’m loading more than 117 pages a minute – then we are net positive.

What am I testing you ask?  21 a second… or 1260 pages a minute!  so I’m actually load testing at 10 times their maximum load for the last 3 months.  I think that I can wind back the testing wait time and sit back and relax!

A long was to tell a short story–HAFS mounts on an ODA for PrintQueue

Everyone wants to create a disposable compute environment, it’s the right thing to do.

IF your machines / servers are stateless, then this is the first step to being elastic and more portable – think containers…  I know that I’m talking about an ODA here, but you can still put constructs into the design that allow you to be more flexible for HA and DR…  that is taking stateful data from your machines and creating a level of abstraction.

So, helping out with JDE, PrintQueue needs to go!

If you want to make your environment elastic, then eventually you need to put printqueue somewhere else and mount the location on your enterprise server.

Imagine that you did all of this, and then when the filesystem was mounting on boot, it wanted to FSK the mounted drive, and perhaps you do not have a network yet…  Guess what happens – NOTHING

Imagine if this was a ODA and the VM did not really give you great access to grub – wow – you got a problem!

Welcome to my world!

/etc/fstab looked something like:

10.255.252.180:/u01/app/sharedrepo/printqdv /mnt/printqueue  nfs nfsvers=3,rw,bg,intr,0 0

easy – leaving this automatic.  the use of hard is implied if not specified, so we do not need this in the mount options.

We created this FS on ODA_BASE as a repo

oakcli create repo printqdv -size 200G -dg DATA

Then on ODA_BASE created the NFS server using grid based srvctl (HAFS) which

srvctl stop exportfs -name printqdv
srvctl remove exportfs -name printqdv
  srvctl add exportfs -name printqdv -id havip_1 -path /u01/app/sharedrepo/printqdv -clients 10.255.252.150 –options rw,no_root_squash"
srvctl start exportfs -name printqdv

So we have a shared printqueue as a repo on ODA_BASE that all of the guests can mount using NFS.  Therefore when using WSJ, all jobs are in a single location and we can support seamless augmentation of logic hosts.

But, when automounting on guests (enterprise servers), we found though is when the machine needed to FSK, it wanted to do this to the printQueue and would not boot.

This is highly risky, we implemented the following:

10.255.252.180:/u01/app/sharedrepo/printqdv /mnt/printqueue  nfs nfsvers=3,rw,bg,intr,_netdev 0 0

adding _netdev to try and tell the boot sequence to only attempt this if there was a network, that should be much nicer.  Though I still am a little worried that this is a massive FS and I don’t want to wait for an FSK EVER!

But, could I risk this?  I want to do noauto and have a systemctl command mount the printqueue manually after boot.

go to this dir as root

/etc/systemd/system

create a new file (use a name that you want for your service)

vi jdePrintQ.service

Add the following contents

[Unit]
Description=JD Edwards PrintQueue
After=network.target

[Service]
#these need a full path
ExecStart=/usr/bin/mount /mnt/printqueue
ExecStop=/usr/bin/umount /mnt/printqueue

[Install]
WantedBy=multi-user.target

Now chmod

chmod 755 ./jdePrintQ.service

you can now use the command systemctl start jdePrintQ and she’ll start – easy

You can stop it too

systemctl stop jdePrintQ

get the status

systemctl status jdePrintQ

Aug 08 12:41:29 bear. systemd[1]: Started JD Edwards PrintQueue.
Aug 08 12:41:29 bear. systemd[1]: Starting JD Edwards PrintQueue...
Aug 08 12:41:29 bear. mount[3351]: mount.nfs: /mnt/printqueue is busy or already mounted
Aug 08 12:41:29 bear. systemd[1]: jdePrintQ.service: main process exited, code=exited, status=32/n/a
Aug 08 12:41:29 bear. systemd[1]: Unit jdePrintQ.service entered failed state.
Aug 08 12:41:29 bear. systemd[1]: jdePrintQ.service failed.

I guess that this is belt and braces, but rescuing a non booting VM on an ODA is not the most fun job in the world.

Just ensure that fstab now looks like this too:

10.255.252.180:/u01/app/sharedrepo/printqdv /mnt/printqueue  nfs nfsvers=3,rw,bg,intr,_netdev,noauto 0 0

The addition of noauto

Make sure you set your service to start on boot:

[root@bear system]# chkconfig jdePrintQ on
Note: Forwarding request to 'systemctl enable jdePrintQ.service'.
Created symlink from /etc/systemd/system/multi-user.target.wants/jdePrintQ.service to /etc/systemd/system/jdePrintQ.service.


It’s really important that you are ready to rescue a VM’s boot disk or any disk for that matter on the ODA.  Remember that if a repo runs out of space, or there is an ACFS problem (which we had lots of) that prevents ODA_BASE seeing / writing to the repo.  You are probably going to get corrupt machines – or at least the need to FSK drives.  Make sure that you have the ability to clone a boot disk and mount it to a temporary guest so that you can fix any problems with the /etc/fstab or other files that might be giving you problems on boot.  Perhaps you can stop services too.  I did NOT have a problem getting to the console of the machine.

Wednesday, 1 August 2018

Garbage collection and tuning the JVM for JDE

This starts to get pretty complex pretty quickly.

We’ve noticed that a JDE web install on Azure feels slow, something feels wrong.

You coad load up 20 users with OATS and watch weblogic 12.2.1.2.0 start to slow down

Actually, speed is not the problem, the machine grinds to a halt with CPU usage.

We are using a super simple JD Edwards test, just basic navigation around P01012 and WSJ.  Could not get easier – you’d think

The machine is on struggle street.

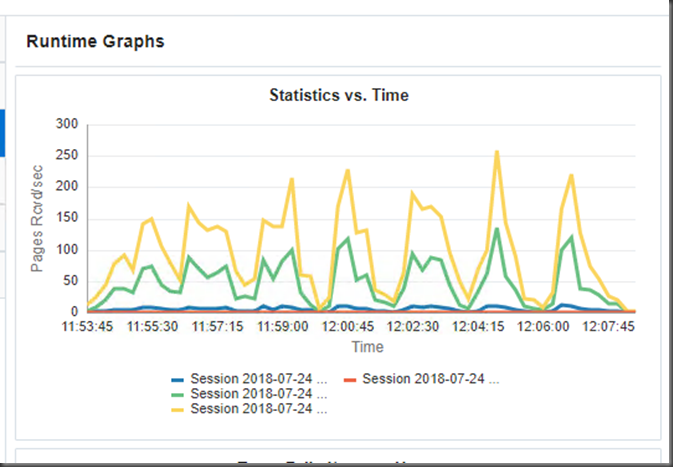
We are seeing the GC’s on the machine:
51042DBF

Look at the GC’s!

Too bouncy.  This is 25 users doing the same thing and logging in at different times.  There should be completely flat lines.
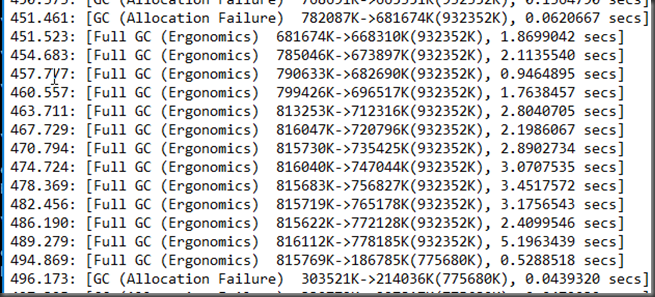

image

Wow, we are getting a full GC which is a total lockup of the JVM pretty much ALL of the time.  Taking up to 9 seconds at times.

We need to get a fix for this.

What you quickly learn about GC in JVM’s is that there are 10000 parameters and without knowing how the objects are allocated by JDE, JDBC etc it’s hard to know which levers you should be pulling.

The tip here it, what levers is java pulling by default?

Let’s find out.

create a file called hello.java and paste in the following:


public class hello {

    public static void main(String[] args) {

        // Prints "Hello, World" to the terminal window.

        System.out.println("Hello, Garbage");

    }

}

image

Then javac hello.java

Do this from the jdk that is running your JVM.  you might need to ps or task manage your way to finding this part of the command line.

image


C:\Program Files\Java\jdk1.8.0_162\bin>javac hello.java

C:\Program Files\Java\jdk1.8.0_162\bin>java -Xloggc:c:/GC/%t_gclogger.log -XX:+PrintGC -XX:-PrintGCDetails hello

Hello, Garbage


You are telling java to be verbose and print you what it’s starting with, nice.

So now you can goto c:\GC and find out what (windows 2016 in my case) is defaulted to run with java


Java HotSpot(TM) 64-Bit Server VM (25.162-b12) for windows-amd64 JRE (1.8.0_162-b12), built on Dec 19 2017 20:00:03 by "java_re" with MS VC++ 10.0 (VS2010)

Memory: 4k page, physical 16776756k(7382136k free), swap 20970920k(5873592k free)

CommandLine flags: -XX:InitialHeapSize=268428096 -XX:MaxHeapSize=4294849536 -XX:+PrintGC -XX:-PrintGCDetails -XX:+PrintGCTimeStamps -XX:+UseCompressedClassPointers -XX:+UseCompressedOops -XX:-UseLargePagesIndividualAllocation -XX:+UseParallelGC 

So this is the naked truth for what the windoze JVM thinks that it should start with.

you can find all of the options listed here http://www.oracle.com/technetwork/java/javase/tech/vmoptions-jsp-140102.html

Using this iknowledge for JDE WLS is easy, at least you are going to know what the default params are.  The other nice this is that if you enable verbose GC logging, you’ll be able to check the JVM history nice and easy


Java HotSpot(TM) 64-Bit Server VM (25.92-b14) for windows-amd64 JRE (1.8.0_92-b14), built on Mar 31 2016 21:03:04 by "java_re" with MS VC++ 10.0 (VS2010)

Memory: 4k page, physical 16776756k(11436092k free), swap 20970920k(14323404k free)

CommandLine flags: -XX:+AggressiveOpts -XX:InitialHeapSize=2147483648 -XX:MaxHeapSize=2147483648 -XX:+PrintGC -XX:-PrintGCDetails -XX:+PrintGCTimeStamps -XX:+TraceClassLoading -XX:+TraceClassResolution -XX:+UseCompressedClassPointers -XX:+UseCompressedOops -XX:-UseLargePagesIndividualAllocation -XX:+UseParallelGC

9.772: [GC (Metadata GC Threshold)  356941K->37709K(2010112K), 0.0497603 secs]

9.822: [Full GC (Metadata GC Threshold)  37709K->36962K(2010112K), 0.1157298 secs]

12.303: [GC (Metadata GC Threshold)  104455K->51591K(2010112K), 0.0146142 secs]

12.318: [Full GC (Metadata GC Threshold)  51591K->32982K(2010112K), 0.0572060 secs]

12.490: [GC (System.gc())  56999K->33214K(2010112K), 0.0015203 secs]

12.492: [Full GC (System.gc())  33214K->23886K(2010112K), 0.1942664 secs]

24.818: [GC (Metadata GC Threshold)  518419K->68032K(2010112K), 0.0430348 secs]

24.862: [Full GC (Metadata GC Threshold)  68032K->66171K(2010112K), 0.2901091 secs]

77.256: [GC (Allocation Failure)  590971K->231300K(2010112K), 0.1385489 secs]

85.555: [GC (Allocation Failure)  756100K->287925K(1813504K), 0.1240276 secs]

88.482: [GC (Allocation Failure)  616117K->264082K(1911808K), 0.0430451 secs]

91.890: [GC (Allocation Failure)  592274K->262682K(1938944K), 0.0406183 secs]

95.013: [GC (Allocation Failure)  633882K->264546K(1927680K), 0.0386120 secs]

97.406: [GC (Allocation Failure)  635746K->261578K(1955840K), 0.0398701 secs]

104.722: [GC (Metadata GC Threshold)  564677K->278930K(1948672K), 0.0511449 secs]

104.773: [Full GC (Metadata GC Threshold)  278930K->126063K(1948672K), 0.2996287 secs]

271.829: [GC (Allocation Failure)  535151K->179467K(1964032K), 0.0409892 secs]

1712.011: [GC (Allocation Failure)  606987K->143383K(1958912K), 0.0272208 secs]

2124.193: [GC (Allocation Failure)  570903K->188328K(1969152K), 0.0613237 secs]

2130.849: [GC (Allocation Failure)  624552K->211110K(1962496K), 0.0687304 secs]

2140.347: [GC (Allocation Failure)  647334K->246768K(1937920K), 0.1185877 secs]

2145.322: [GC (Allocation Failure)  655856K->299962K(1952256K), 0.1423171 secs]

2152.052: [GC (Allocation Failure)  709050K->347231K(1825280K), 0.1426725 secs]

2153.875: [GC (Metadata GC Threshold)  460486K->366841K(1845248K), 0.1227049 secs]

2153.997: [Full GC (Metadata GC Threshold)  366841K->275362K(1845248K), 1.1694144 secs]

2158.558: [GC (Allocation Failure)  557474K->297258K(1872384K), 0.0199824 secs]

2161.004: [GC (Allocation Failure)  547626K->304734K(1872896K), 0.0478987 secs]

2165.078: [GC (Allocation Failure)  555102K->336275K(1885696K), 0.0419868 secs]

2167.680: [GC (Allocation Failure)  602515K->398773K(1875968K), 0.1051175 secs]

2171.856: [GC (Allocation Failure)  665013K->435986K(1853440K), 0.1449460 secs]

2175.736: [GC (Allocation Failure)  677138K->464323K(1828352K), 0.1165887 secs]

2180.276: [GC (Allocation Failure)  705475K->492642K(1864192K), 0.1381040 secs]

2183.488: [GC (Allocation Failure)  725602K->511599K(1864192K), 0.1451506 secs]

2187.965: [GC (Allocation Failure)  744559K->535714K(1864192K), 0.1557600 secs]

2191.799: [GC (Allocation Failure)  768674K->549443K(1864192K), 0.1302633 secs]

2195.937: [GC (Allocation Failure)  782403K->576326K(1864192K), 0.1069931 secs]

2198.253: [GC (Allocation Failure)  809286K->594966K(1864192K), 0.0552789 secs]

2201.184: [GC (Allocation Failure)  827926K->614134K(1864192K), 0.0333154 secs]


I still have this to deal with for 20 users:

image

Wish me luck!

Friday, 20 July 2018

Simple RTE observation - enhancement request

I've blogged a lot about RTE, because I think it's pretty cool.

There is one thing that I do not like...  The fact that it's a challenge to get more than one transaction server running.

Remember that your configuration of subscribers is half the battle - you can configure multiple subscribers and have them separated by name and environment - nicely.

Only subscribe to certain messages for certain environments and wow - everything looks nice from P90701A.

The main problem is that the RTE server polls the F90710 that is defined in the OCMs that you put in the transaction server config.

So, it's poll that table with a very simple SQL

SELECT MIN(ETEVNTSEQ) FROM SY910.F90710 WHERE (ETEVNTST = 3);

The same thing, said another way.

The transaction server does not check subscriber information, this is important.  When defining a subscriber and then a connection and events and active environments, remember that this is not going to completely define where messages will end up...  What do you mean?  I hear you ask.

It's not just triggers from the JDE kernels on the enterprise server that initiate the consumption of RTE, the txn server itself polls the F90710 using the statement above.


The following sequence of screens shows this slight calamity
My subscriber, defined for port 136 only

my subscriptions defined for port 136

My environments saying only PY910 messages

my RTE server in DV with the message!  Boo hoo!

It might be a simplistic point of view, but the transaction server could compare environments that are subscribed to and not grab the messages.  The transaction server could also look at F90706 etc to see if it was the machine that was referenced in the subscriber configuration and once again ignore the messages if this was the case.

Any of the two changes to the code would allow multiple transaction servers using a single set of configuration, much better!


Wednesday, 18 July 2018

advanced orchestration lessons

I’ve had a little help on this one, but I wanted to explain some frustrations / limitations in the current edition of the orchestration studio.

My requirements were simple (I thought).

I wanted to scroll through a complex result set, for each row build a string and eventually send that string to a web service.

My web service took a single payload of a parent | child data sequence.

Simple – yeah?  NO!!

image

My initial thoughts were to create the data request and then a groovy connector to concatenate the strings, but this does not work – as the variables only have scope for each iteration of the result set – i.e. I cannot concatenate and get the results after the entire resultset is complete… arrgghh

I started to get fancy and thought that I could use a connector, but this did not work either.

I started creating edit lines, and begin docs – thinking that I was clever, but this did not work either because of the above variable scope and iteration.

So.

I phoned a friend and Trev gave me a tip of manipulating the output of an orchestration.

I then proceeded to have something like:

image


This is simple.

I recommend that if you are going to use this method, you need to get the output of the data request from your orchestration client before you write code, as you will need to understand the output JSON document format.

image

See that I’ve not done and Add’s to the data, left is standard.

Looks something like:

{
   "ServiceRequest1" : {
     "ds_V4209C" : {
       "output" : [ {
         "groupBy" : {
           "F4209.RPER" : 58026
         },
         "F4301.OTOT_SUM" : 756389.52,
         "F4209.DOCO_COUNT_DISTINCT" : 9
       }, {
         "groupBy" : {
           "F4209.RPER" : 8444
         },
         "F4301.OTOT_SUM" : 228918.32,
         "F4209.DOCO_COUNT_DISTINCT" : 9
       }, {
         "groupBy" : {
           "F4209.RPER" : 58018
         },
         "F4301.OTOT_SUM" : 216092.0,
         "F4209.DOCO_COUNT_DISTINCT" : 7
       }, {
         "groupBy" : {
           "F4209.RPER" : 123238
         },
         "F4301.OTOT_SUM" : 113000.0,
         "F4209.DOCO_COUNT_DISTINCT" : 1
       }, {
         "groupBy" : {
           "F4209.RPER" : 7500
         },
         "F4301.OTOT_SUM" : 24893.75,
         "F4209.DOCO_COUNT_DISTINCT" : 3
       }, {
         "groupBy" : {
           "F4209.RPER" : 6002
         },
         "F4301.OTOT_SUM" : 20000.0,
         "F4209.DOCO_COUNT_DISTINCT" : 1
       }, {
         "groupBy" : {
           "F4209.RPER" : 6001
         },
         "F4301.OTOT_SUM" : 2287.29,
         "F4209.DOCO_COUNT_DISTINCT" : 2
       }, {
         "groupBy" : {
           "F4209.RPER" : 533095
         },
         "F4301.OTOT_SUM" : 1327.5,
         "F4209.DOCO_COUNT_DISTINCT" : 7
       }, {
         "groupBy" : {
           "F4209.RPER" : 7504
         },
         "F4301.OTOT_SUM" : 1000.0,
         "F4209.DOCO_COUNT_DISTINCT" : 1
       }, {
         "groupBy" : {
           "F4209.RPER" : 43393
         },
         "F4301.OTOT_SUM" : 593.75,
         "F4209.DOCO_COUNT_DISTINCT" : 1
       }, {
         "groupBy" : {
           "F4209.RPER" : 533093
         },
         "F4301.OTOT_SUM" : 70.0,
         "F4209.DOCO_COUNT_DISTINCT" : 3
       }, {
         "groupBy" : {
           "F4209.RPER" : 70012
         },
         "F4301.OTOT_SUM" : 25.0,
         "F4209.DOCO_COUNT_DISTINCT" : 1
       } ]
     }
   }

With this, I can formulate the code below.  Note the hierarchy of the output and the use of the iterator.


import groovy.json.JsonSlurper;
import groovy.json.JsonBuilder;
import com.oracle.e1.common.OrchestrationAttributes;
String main(OrchestrationAttributes orchAttr, String input)
{
   def jsonIn = new JsonSlurper().parseText(input);
   // modify jsonIn
    
   String bigString = "";
   orchAttr.writeWarn("TEsting");
   items = jsonIn.ServiceRequest1.ds_V4209C.output.iterator();
   while (items.hasNext()) {
     item = items.next();
     bigString += item.get("F4301.OTOT_SUM") + "|"
   }
   jsonIn.put("concat",bigString);
  
   orchAttr.writeWarn(bigString);
   
   def jsonOut = new JsonBuilder(jsonIn).toString();
  
   return jsonOut;
}

When I run this now, I have an additional parameter at the bottom:

  "concat" : "756389.52|228918.32|216092.00|113000.00|24893.75|20000.00|2287.29|1327.50|1000.00|593.75|70.00|25.00|"

Nice variable name!

So, now I need to create a SR that is a connector type that is going to put this output variable “concat” into my other SR that does an external post to my web service!  Easy.

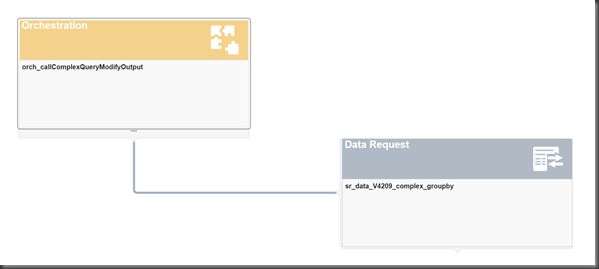
my orchestration looks like this:

image

My connector SR looks like this:

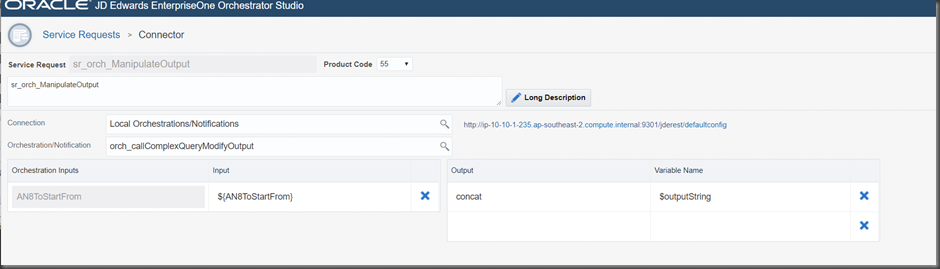
image

Note that the concat variable is defined in the output of the connector SR

So When I call my orchestration that calls the SR that calls an orchestration…

image

I get the output that I want.  The concatenation of the resultset in a string that I can send to my web service, that is great…  A long journey though!