Wednesday, 27 June 2018

Creating aggregate data requests using JDE orchestrator

Aggregate data requests can be a little fiddly, but here we go. I find that the best way to test these is to have a simple orchestration, a simple data request and use the orchestrator client to keep running the queries until you get it right.

I’ve very confident to say that if we are updating a data request service request, I know that as soon as you save in the orchestration studio, you can run that change immediately in orchestration client.

I’m going to show 3 scenarios with 3 different outputs.

Scenario 1

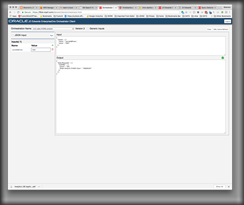
Simple single return of a users total value of PO’s that need approval: No aggregation.

clip_image002

This when tested:

Will return all orders and amounts, ordered by amount desc for the user# that I pass in.

clip_image004

As you can see from the above, I have my summary. Note that this is a record set, but not and aggregation.

Scenario 2:

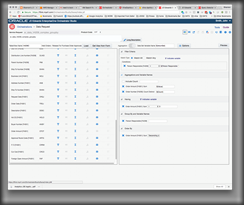
This is slightly more complex, as I’m using aggregation in the query. You can see that I’m including the “generic count”

clip_image006

And the sum of the amount

clip_image008

clip_image010

This results in

clip_image012

Note that this is a single row response because I’m using “assigned to” in the where clause. This is using aggregation and also using sum. A nice query – notice how there is no record set because of the where clause being a single response. This is ALSO the case because I’ve selected:

clip_image014

This is very important. If you include count as above, you must formulate your query to only respond with a single row back – trick for beginners.

Scenario 3:

This is the grizzly bear. I want a result set, which summarises all people who have outstanding PO’s. I want to know the value and the count of the outstanding PO’s too. I want to only see those with a value greater than 0.

clip_image016

The above screen shows all of these elements (do not include count)

clip_image018

This will prevent it from working.

The elements of this are that there is a where clause, as I do not really want one – but am forced, I’ll say where AN8 > 1! I want the sum and count of orders grouped by the person responsible. I also order by order amount desc. I could order by the count of distinct orders too.

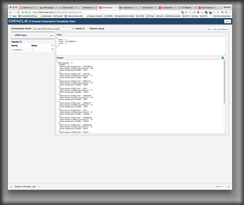
Everything else will work as designed, here is the return

clip_image020

Problem:

Aggregation with group by is not a return set.

clip_image022

Note that I want to send an email for each result in the returnset, but I think when you use aggregates, there is only a single return set… Doh!

Monday, 25 June 2018

Configuring JMSToolBox to read messages from JDE RTE / Transaction server (weblogic)

Want to look at web logic JMS queue contents?  Want to add some more messages or taketh them away?  This is the post for you.

1. Download JMStoolbox

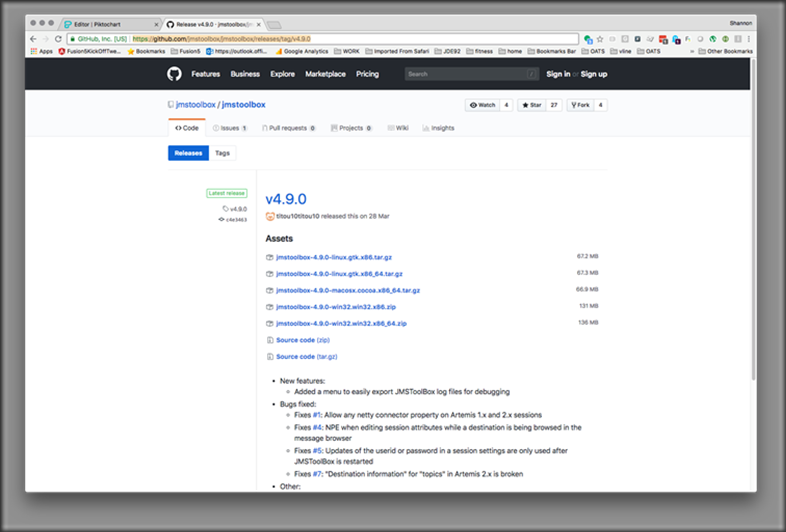
Check out this https://github.com/jmstoolbox

choose latest release https://github.com/jmstoolbox/jmstoolbox/releases/tag/v4.9.0

clip_image002

Grab the windoze build for 64 bit, it includes java (don’t tell oracle)

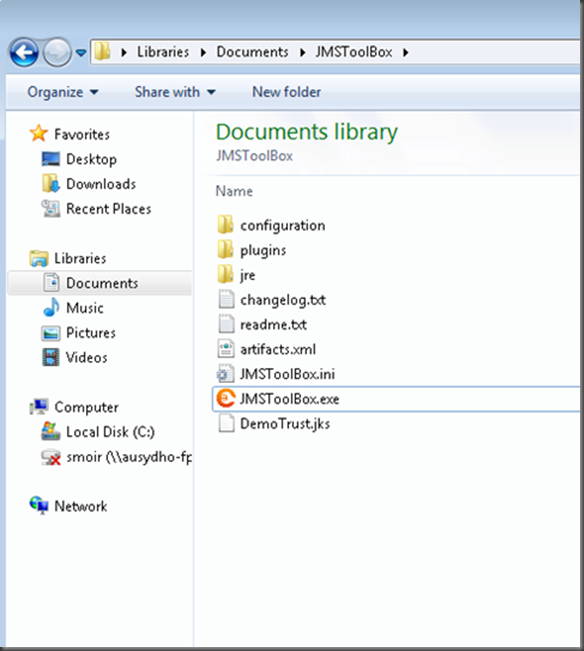
2. Unpack, dir should look like:

clip_image004

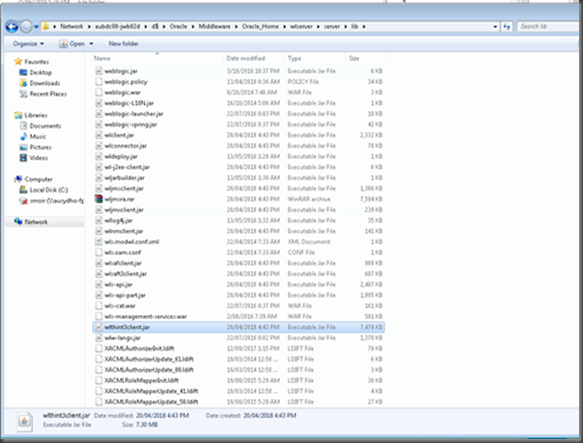
Grab a copy of wlthin3client.jar from the weblogic server, as seen below: It’s in a a dir something like %ORACLE_HOME%\wlserver\server\lib

clip_image006

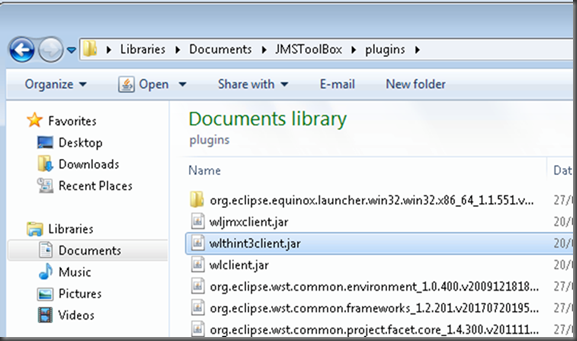
Copy it into the lib dir for the JMSToolBox program:

clip_image008

Now, start JMSToolBox

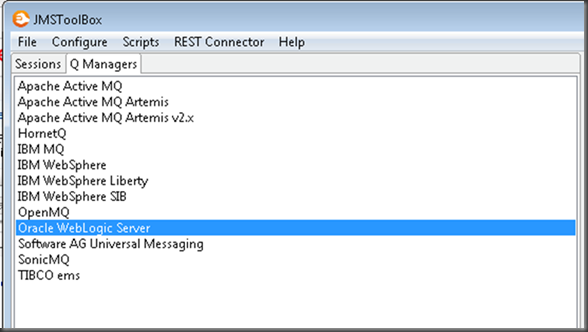
Goto Q Managers and add Oracle WebLogic Server config

clip_image010

Right click weblogic and choose configure

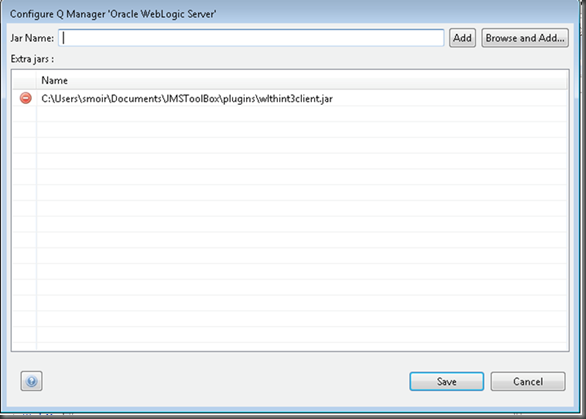
clip_image012

Add the wlthin3client.jar

Great!

Back to sessions

clip_image014

Choose add

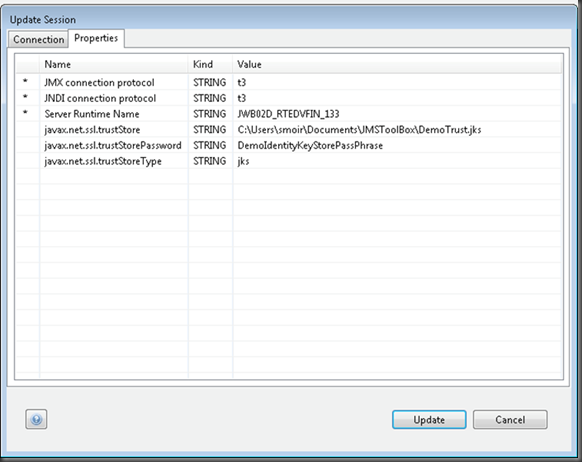
Create configuration as this screen

clip_image016

Note that is you are JDE, more likely you do not need t3s, but I was testing. Note also that is the value of the default trust password, nice!

clip_image018

Now when you connect to your server / port combination, you’ll see the messages from JDE into your transaction server.

You then have a bunch of cool options to work with the messages

clip_image020

Saturday, 23 June 2018

What good performance looks like–Good to Great


Lots of clients at the moment are getting rid of their proprietary CPU architecture.  This comes in the form of RISC type implementations and moving to commodity x86 architecture.  There are a lot of advantages in this, but the primary seems to be the strategic of enabling an easier cloud migration when the time is right. 

I’m assisting with a number of very large platform migrations at the moment – moving from AS/400 to cloud or commodity.  Generally if people are moving off a 400 today, they have been on that platform for a long time..  As I doubt that ANYONE would buy JDE at the moment and get an AS/400 to run it on.  In fact, I doubt that has occurred in the last 8 years (am I wrong – tell me).

So, we are generally migrating 10-20 years of history and customisation to another platform.  It’s rarely JDE that is the problem in this type of migration, it’s all of the stuff that sits on the side of JDE.  The integrations, CL, RPG and custom SQL statements and triggers that make a migration tricky.

There is one more thing that makes this tricky – PERFORMANCE!  Never underestimate the amazing ability that an AS/400 has to process inefficient code well!  It is awesome at masking bad code by monstoring the job with great I/O, reactive (and somewhat invisible tuning) and very quick CPUs.

I quite often need to spend a lot of time tuning the workload (especially custom code) to get the new platforms to behave like the old – and to be honest, sometimes it will not happen…  A massive tablescan based UBE might just take longer on two-tier architecture and single tier AS/400 – but it’s the exception not the rule.

In general large SQL will run faster on new hardware – but it’s the transfer and processing of large datasets that can be problematic.

Look at the graph below.  This shows a client that has recently done a platform migration to Oracle database appliance (X7HA).  This is really smashing the workload, processing Trillions of I/O’s in the first week – yes Trillions!!! 

You can see a pretty cool and consistent graph below of page load times in JDE vs. activity.  The fusion5 ERP analytics suite allows insights like this.  We can see that the interactive performance actually improves when the site gets loaded up.  Makes sense to me.  Better cache is loaded and the users get a better experience.  What does interest me is that 10am when the users are at their most, we have page response time of about .45 seconds – which is amazing (I know, I have over 40 clients to compare with).

It’s really cool to be able to give clients these REAL insights into performance of their new platform and give them unequivocal empirical evidence that they’ve done the right thing and that their users are getting an exceptional interactive experience from the new hardware.

image


We are also able to drill down into some very detailed numbers on where performance problems might be – slowest screens, apps, regions, servers or users.

image

Sunday, 3 June 2018

9.2, OSA and output management

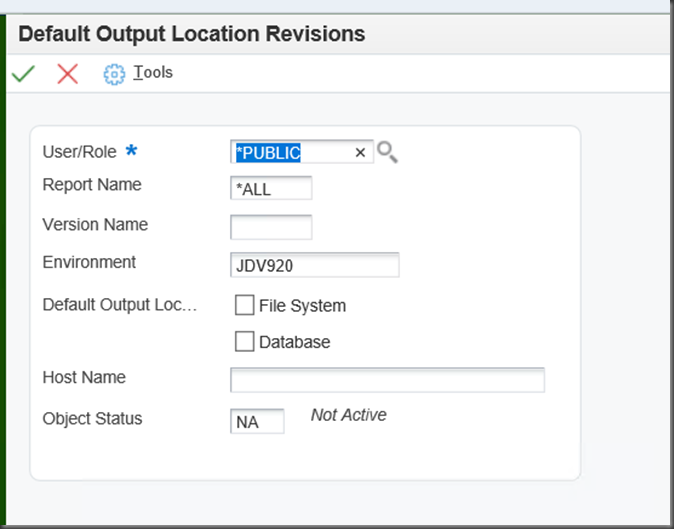
OSA’s do work in 9.2, but you need to activate filesystem output.

You need to activate your report in P98617 to ensure that filesystem output is enabled

clip_image002

So then you can add individual entries

image

Once you have done this, all of the standard OSA functionality is going to work!  YAY!


I did try and leave the PDF / CSV in the database, but the only function I could find to crab it was not exported to the server:

  JDEGetPDFFile(hUser,
             pOSAReportInfo->szHostName,
             pOSAReportInfo->ulJobNum,
             (BYTE *)szLocalFileName,
             &eRetCode);

So, don’t bother trying that.  It’s exported to the client jdekrnl.lib – but not the server.

This might seem cryptic to most people, but if you’ve programmed OSA’s before (they are SOOOO RAD!!!), then this is good info.

Remember that an OSA can be triggered after a UBE and can do things with the output – perfect for emailing and printing automatically.  I have one that turns on logging, that is cool too!

Extending JDE to generative AI